Warrensburg: Fire Incidents, Illinois (IL)
Where are fire incidents reported in Warrensburg, IL
Something went wrong! Please refresh the page.
|
| |||||||||||||||||||||||||||||||||||||||||||||||||||||||||||||||||||||||||||||||||||||||||||||||||||||||||||||
2002 - 2018 National Fire Incident Reporting System (NFIRS) incidents
- Incident types reported to NFIRS in Warrensburg, IL
- 36830.8%Rescue & EMS
- 28623.9%Fire
- 22118.5%Hazardous Condition
- 15012.5%Good Intent Call
- 937.8%Service Call
- 494.1%False Alarm
- 272.3%Severe Weather
- Fire incident types reported to NFIRS in Warrensburg, IL
- 12242.7%Outside Fires
- 11941.6%Structure Fires
- 3612.6%Mobile Property/Vehicle Fires
- 93.1%Other
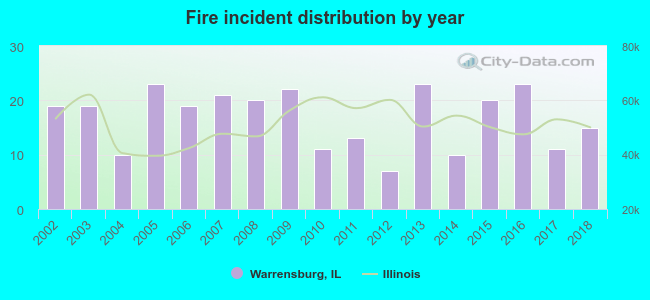 According to the data from the years 2002 - 2018 the average number of fires per year is 17. The highest number of reported fires - 23 took place in 2005, and the least - 7 in 2012. The data has a dropping trend.
 32.2% incidents where reported in the morning and 67.8% in the evening. The most fires (17.1%) took place on Wednesday, and the least (11.9%) on Tuesday.
 According to the 286 reports from years 2002 - 2018 most fires (13.6%) took place during September, and the least (4.2%) in August.
 Out of all 1,196 cases reported during the years 2002 - 2018, the most belonged to the categories: Rescue & EMS (30.8%), Fire (23.9%), and Hazardous Condition (18.5%).
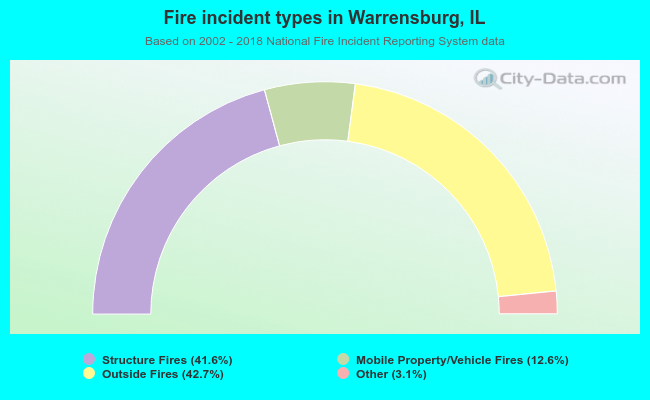 When looking into fire subcategories, the most reports belonged to: Outside Fires (42.7%), and Structure Fires (41.6%).