| Fire incidents reported |
|---|
| Sreet name | Count |
|---|
| MAIN ST | 16 | | ROUTE 51 | 14 | | CARL SPRINGS RD | 8 | | CARL SPRINGS RD | 8 | | LOCUST ST | 8 | | MAIN | 8 | | OAK ST | 8 | | ROUTE 51 NORTH | 8 | | THORPS RD | 8 | | CHERRY RD | 6 | | LOCUST | 6 | | US HIGHWAY 51 | 6 | | BUCKS ROAD | 4 | | CARLE SPRINGS RD | 4 | | CHESTNUT ST | 4 | | COUNTY HIGHWAY 10 | 4 | | IRISH ROW RD | 4 | | PRIMROSE RD | 4 | | ROUTE 51 SOUTH | 4 | | TABOR RD | 4 | | THORPS RD | 4 | | WAYNESVILLE RD | 4 | | WAYNESVILLE RD | 4 | | 1000 EAST RD | 2 | | 1000 NORTH | 2 |
| | | Fire incidents reported |
|---|
| Sreet name | Count |
|---|
| 10523 TABOR ROAD | 2 | | 1100 NORTH RD | 2 | | 115 N. CHESTNUT | 2 | | 1200 NORTH RD | 2 | | 1375N | 2 | | 1400 NORTH | 2 | | 1400 NORTH RD | 2 | | 1450 NORTH ROAD | 2 | | 14635 AUTUMN ROAD | 2 | | 1625E | 2 | | 2ND ST | 2 | | 300 MAIN | 2 | | 4TH ST | 2 | | 7834 CARLE SPRINGS | 2 | | 943E-900N | 2 | | ALEXANDER RD | 2 | | ANGUS RD | 2 | | ANGUS RD AND THORPS RD | 2 | | APRICOT RD | 2 | | APRICOT AND BUCKS RD | 2 | | APRICOT RD | 2 | | AUTM AND BUCKS RD | 2 | | AUTMUN ROAD | 2 | | AUTNUM RD | 2 | | |
|
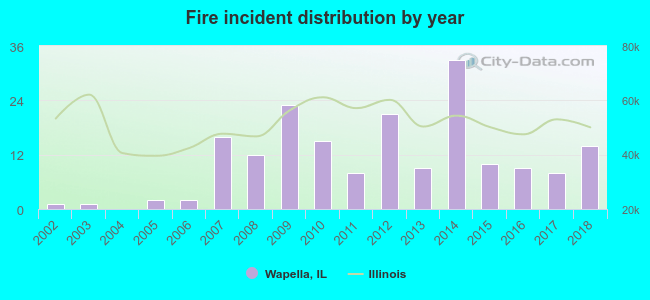 According to the data from the years 2002 - 2018 the average number of fires per year is 11. The highest number of reported fires - 33 took place in 2014, and the least - 0 in 2004. The data has a growing trend.
 29.9% incidents where reported in the morning and 70.1% in the evening. The most fires (19.0%) took place on Monday, and the least (8.7%) on Friday.
 According to the 184 reports from years 2002 - 2018 most fires (23.4%) took place during April, and the least (2.2%) in February.
 Out of all 487 cases reported during the years 2002 - 2018, the most belonged to the categories: Overpressure Rupture (46.0%), Fire (37.8%), and Rescue & EMS (8.6%).
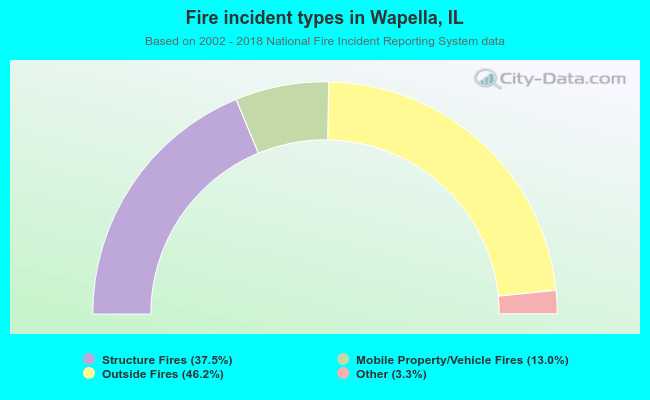 When looking into fire subcategories, the most reports belonged to: Outside Fires (46.2%), and Structure Fires (37.5%).