| Fire incidents reported |
|---|
| Sreet name | Count |
|---|
| LEHIGH DR | 28 | | RIVERVIEW DR | 22 | | MOUNTAIN VIEW DR | 12 | | ALMOND RD | 10 | | CEDAR DR | 8 | | COTTONWOOD RD | 8 | | HILLVIEW DR | 8 | | STEVEN LN | 8 | | TIMBERLINE RD | 8 | | WASHINGTON DR | 8 | | 3RD ST | 6 | | BEST AVE | 6 | | BUTTERNUT DR | 6 | | CYPRESS DR | 6 | | HILLVIEW | 6 | | LINCOLN AVE | 6 | | MAIN ST | 6 | | UPPER THREE MILE LN | 6 | | WASHINGTON ST | 6 | | WOOD DR | 6 | | 5TH ST | 4 | | BEECH DR | 4 | | BLUE MOUNTAIN DR | 4 | | BUNKER HILL LN | 4 | | COTTONWOOD | 4 |
| | | Fire incidents reported |
|---|
| Sreet name | Count |
|---|
| COTTONWOOD DR | 4 | | CYPRESS RD | 4 | | KIDDIE LN | 4 | | LEHIGH | 4 | | MAPLE DR | 4 | | MOUNTAINVIEW DR | 4 | | MULBERRY DR | 4 | | OAK RD | 4 | | OVERLOOK CIR | 4 | | RIVERVIEW | 4 | | SPRING DR | 4 | | WILLIAMS AVE | 4 | | 1197 RIVERVIEW DR | 2 | | 1200 RIVERVIEW DR | 2 | | 1306 RIVERVIEW DR | 2 | | 1341 SPRING DR | 2 | | 3611 BEECH DRIVE | 2 | | 4555 LEHIGH DRIVE | 2 | | 4613 W. MOUNTAIN VIEW DR | 2 | | 4727 THREE MILE LANE | 2 | | 4739 S. CYPRESS DRIVE | 2 | | 498 MULBERRY DRIVE | 2 | | 995 WOODLAND DRIVE | 2 | | ALDER DR | 2 | | |
|
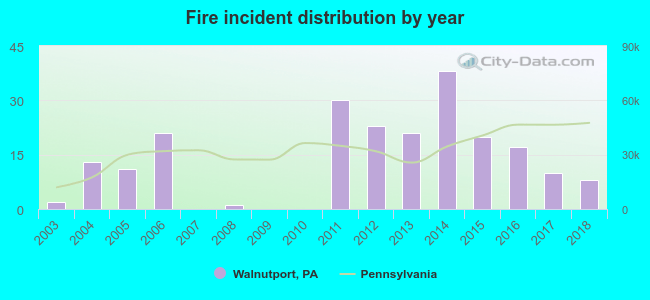 Based on the data from the years 2003 - 2018 the average number of fires per year is 13. The highest number of reported fires - 38 took place in 2014, and the least - 0 in 2007. The data has an increasing trend.
 34.4% incidents where reported in the morning and 65.6% in the evening. The most fires (18.6%) took place on Saturday, and the least (9.8%) on Friday.
 According to the 215 incident reports from years 2003 - 2018 most fires (16.7%) took place during February, and the least (2.3%) in August.
 Out of all 718 cases reported during the years 2003 - 2018, the most belonged to the categories: Fire (29.9%), Rescue & EMS (25.1%), and Overpressure Rupture (23.1%).
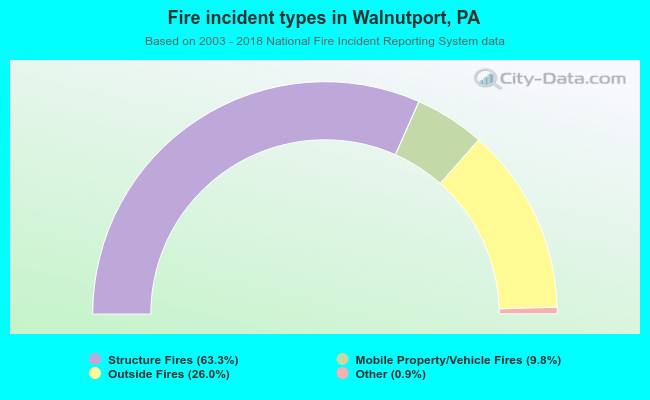 When looking into fire subcategories, the most reports belonged to: Structure Fires (63.3%), and Outside Fires (26.0%).