Walnut: Fire Incidents, Illinois (IL)
Where are fire incidents reported in Walnut, IL
Something went wrong! Please refresh the page.
|
| |||||||||||||||||||||||||||||||||||||||||||||||||||||||||||||||||||||||||||||||||||||||||||||||||||||||||||||
| Other | 79 | |||||||||||||||||||||||||||||||||||||||||||||||||||||||||||||||||||||||||||||||||||||||||||||||||||||||||||||
2002 - 2018 National Fire Incident Reporting System (NFIRS) incidents
- Incident types reported to NFIRS in Walnut, IL
- 24363.6%Fire
- 5714.9%Hazardous Condition
- 389.9%Rescue & EMS
- 246.3%False Alarm
- 153.9%Good Intent Call
- 51.3%Service Call
- Fire incident types reported to NFIRS in Walnut, IL
- 12049.4%Outside Fires
- 8233.7%Structure Fires
- 249.9%Mobile Property/Vehicle Fires
- 177.0%Other
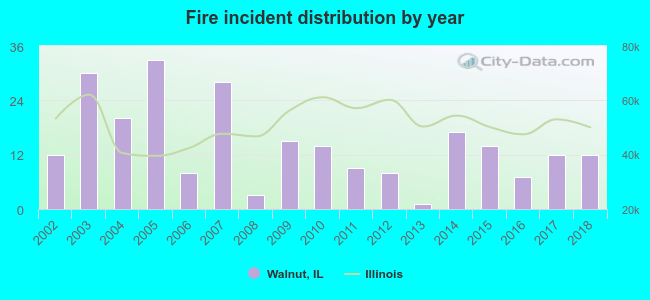 According to the data from the years 2002 - 2018 the average number of fires per year is 14. The highest number of reported fires - 33 took place in 2005, and the least - 1 in 2013. The data has a constant trend.
 27.6% incidents where reported in the morning and 72.4% in the evening. The most fires (21.0%) took place on Tuesday, and the least (11.1%) on Friday.
 According to the 243 incident reports from years 2002 - 2018 most fires (17.3%) took place during March, and the least (3.3%) in February.
 Out of all 382 cases reported during the years 2002 - 2018, the most belonged to the categories: Fire (63.6%), Rescue & EMS (14.9%), and Overpressure Rupture (9.9%).
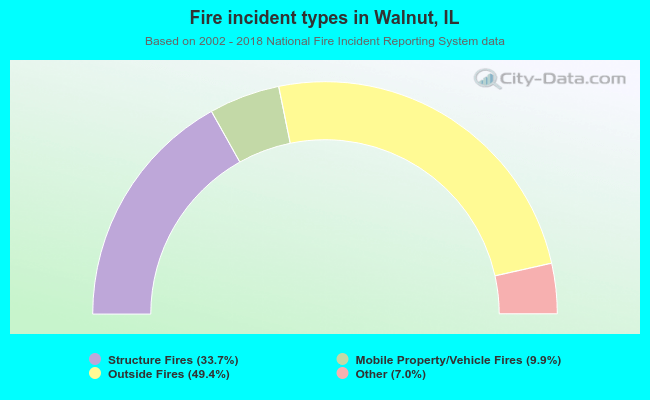 When looking into fire subcategories, the most reports belonged to: Outside Fires (49.4%), and Structure Fires (33.7%).