Walkertown: Fire Incidents, North Carolina (NC)
Where are fire incidents reported in Walkertown, NC
Something went wrong! Please refresh the page.
| Fire incidents reported | |
|---|---|
| Sreet name | Count |
| PINE HALL RD | 154 |
| OLD HOLLOW RD | 118 |
| REIDSVILLE RD | 104 |
| MAIN ST | 98 |
| SULLIVANTOWN RD | 98 |
| CAMP BETTY HASTINGS RD | 78 |
| OLD WALKERTOWN RD | 76 |
| NEW WALKERTOWN RD | 60 |
| BELEWS CREEK RD | 54 |
| OLD HOLLOW (WA) RD | 54 |
| MECUM RD | 52 |
| WILLISTON RD | 46 |
| WALNUT COVE RD | 44 |
| CAIN FOREST DR | 42 |
| EFFIE LN | 40 |
| DAVIS RD | 38 |
| DARROW RD | 32 |
| GRUBBS RD | 32 |
| OLD HOLLOW (NE) RD | 32 |
| BEN LN | 30 |
| MARTINS TRAIL CIR | 30 |
| REIDSVILLE (WA) RD | 30 |
| SALEM RD | 30 |
| TALPHIN DR | 28 |
| DAY RD | 24 |
| JONES RD | 24 |
| OAK BRANCH LN | 24 |
| OLD HOLLOWWA RD | 24 |
| VANCE RD | 24 |
| MCGEE RD | 22 |
2002 - 2018 National Fire Incident Reporting System (NFIRS) incidents
- Incident types reported to NFIRS in Walkertown, NC
- 2,54941.3%Rescue & EMS
- 1,53324.9%Fire
- 67611.0%Hazardous Condition
- 65910.7%Good Intent Call
- 4587.4%Service Call
- 2654.3%False Alarm
- 210.3%Special Incident
- Fire incident types reported to NFIRS in Walkertown, NC
- 60739.6%Structure Fires
- 46430.3%Other
- 36523.8%Outside Fires
- 976.3%Mobile Property/Vehicle Fires
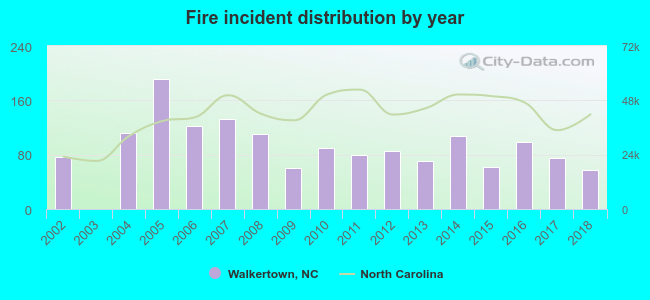 According to the data from the years 2002 - 2018 the average number of fire incidents per year is 90. The highest number of reported fire incidents - 192 took place in 2005, and the least - 0 in 2003. The data has a decreasing trend.
 The median response time based on all reported fire incidents is 7 minutes. This is about the same as the state median value.
The median response time in Walkertown, NC compared to nearest cities:
(Note: Based on data for all years, including only cities with at least 500 fire incidents)
| Walkertown: | 7 minutes |
| Hampstead: | 8 minutes |
| Kernersville: | 5 minutes |
| Winston-Salem: | 4 minutes |
| Rural Hall: | 8 minutes |
| Walnut Cove: | 9 minutes |
| Stokesdale: | 7 minutes |
| King: | 8 minutes |
| Lewisville: | 7 minutes |
 Based on the data from the years 2002 - 2018 the average number of fire-related yearly casualties is 1. The highest number of injuries - 2 took place in 2014, and the lowest - 0 in 2002. The data has an increasing trend.
The average number of casualties per 1,000 fires is 7. This indicator was the highest - 34 in 2018, and the lowest 0 in 2002. The trend for casualties per 1,000 incidents is increasing. Compared to the North Carolina value the number of injuries per 1,000 fire incidents is similar.
Based on the data from the years 2002 - 2018 the average number of fire-related yearly casualties is 1. The highest number of injuries - 2 took place in 2014, and the lowest - 0 in 2002. The data has an increasing trend.
The average number of casualties per 1,000 fires is 7. This indicator was the highest - 34 in 2018, and the lowest 0 in 2002. The trend for casualties per 1,000 incidents is increasing. Compared to the North Carolina value the number of injuries per 1,000 fire incidents is similar.Casualties per 1,000 incidents in Walkertown, NC compared to nearest cities:
(Note: Based on data for all years, including only cities with at least 500 fire incidents)
| Walkertown: | 5.9 |
| Hampstead: | 6.4 |
| Kernersville: | 13.6 |
| Winston-Salem: | 14.9 |
| Rural Hall: | 7.0 |
| Walnut Cove: | 1.9 |
| Stokesdale: | 5.8 |
| King: | 9.7 |
| Lewisville: | 5.6 |
 32.7% incidents where reported in the morning and 67.3% in the evening. The most fires (16.0%) took place on Monday, and the least (12.7%) on Tuesday.
 Based on the 1,533 incident reports from years 2002 - 2018 most fires (12.9%) took place during January, and the least (4.7%) in August.
 Out of all 6,165 cases reported during the years 2002 - 2018, the most belonged to the categories: Rescue & EMS (41.3%), Fire (24.9%), and Hazardous Condition (11.0%).
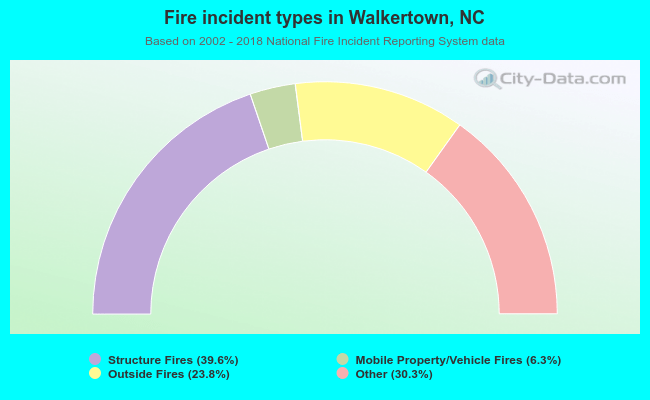 When looking into fire subcategories, the most incidents belonged to: Structure Fires (39.6%), and Other (30.3%).