Walbridge: Fire Incidents, Ohio (OH)
Where are fire incidents reported in Walbridge, OH
Something went wrong! Please refresh the page.
|
| |||||||||||||||||||||||||||||||||||||||||||||||||||||||||||||||||||||||||||||||||||||||||||||||||||||||||||||
2002 - 2018 National Fire Incident Reporting System (NFIRS) incidents
- Incident types reported to NFIRS in Walbridge, OH
- 1,92265.2%Rescue & EMS
- 37812.8%Fire
- 2679.1%Hazardous Condition
- 2438.2%Good Intent Call
- 652.2%False Alarm
- 612.1%Service Call
- 70.2%Severe Weather
- 30.1%Overpressure Rupture
- Fire incident types reported to NFIRS in Walbridge, OH
- 16343.1%Structure Fires
- 14137.3%Outside Fires
- 7319.3%Mobile Property/Vehicle Fires
- 10.3%Other
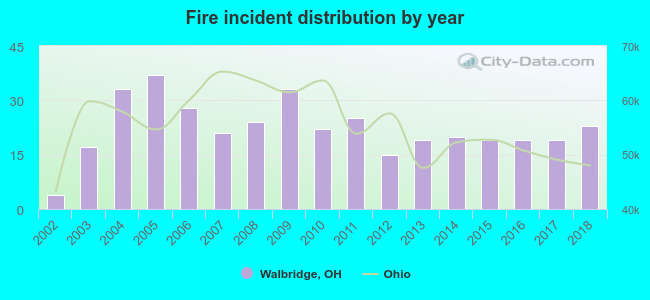 Based on the data from the years 2002 - 2018 the average number of fire incidents per year is 22. The highest number of fires - 37 took place in 2005, and the least - 4 in 2002. The data has a rising trend.
 According to the data from the years 2002 - 2018 the average number of fire-related yearly casualties is 0. The highest number of reported casualties - 1 took place in 2006, and the lowest - 0 in 2002. The data has a rising trend.
 31.0% incidents where reported in the morning and 69.0% in the evening. The most fires (19.8%) took place on Thursday, and the least (10.6%) on Saturday.
 According to the 378 incident reports from years 2002 - 2018 most fires (13.8%) took place during July, and the least (4.8%) in September.
 Out of all 2,947 cases reported during the years 2002 - 2018, the most belonged to the categories: Rescue & EMS (65.2%), Fire (12.8%), and Hazardous Condition (9.1%).
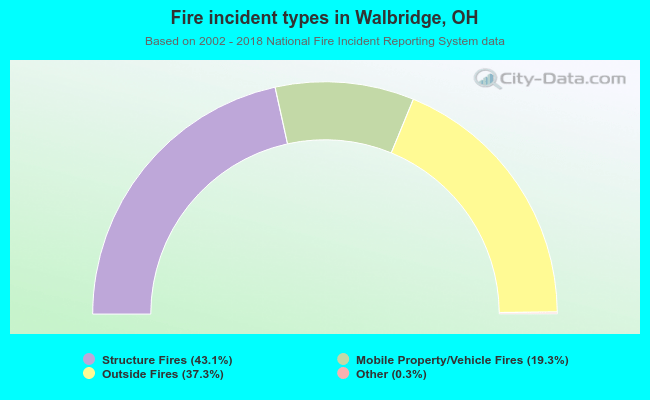 When looking into fire subcategories, the most incidents belonged to: Structure Fires (43.1%), and Outside Fires (37.3%).