Vinita: Fire Incidents, Oklahoma (OK)
Where are fire incidents reported in Vinita, OK
Something went wrong! Please refresh the page.
|
| |||||||||||||||||||||||||||||||||||||||||||||||||||||||||||||||||||||||||||||||||||||||||||||||||||||||||||||
| Other | 382 | |||||||||||||||||||||||||||||||||||||||||||||||||||||||||||||||||||||||||||||||||||||||||||||||||||||||||||||
2002 - 2018 National Fire Incident Reporting System (NFIRS) incidents
- Incident types reported to NFIRS in Vinita, OK
- 1,50443.9%Fire
- 97928.6%Rescue & EMS
- 3259.5%Good Intent Call
- 2326.8%Service Call
- 2156.3%Hazardous Condition
- 1484.3%False Alarm
- 140.4%Special Incident
- 40.1%Overpressure Rupture
- 40.1%Severe Weather
- Fire incident types reported to NFIRS in Vinita, OK
- 87658.2%Outside Fires
- 34322.8%Structure Fires
- 21214.1%Mobile Property/Vehicle Fires
- 734.9%Other
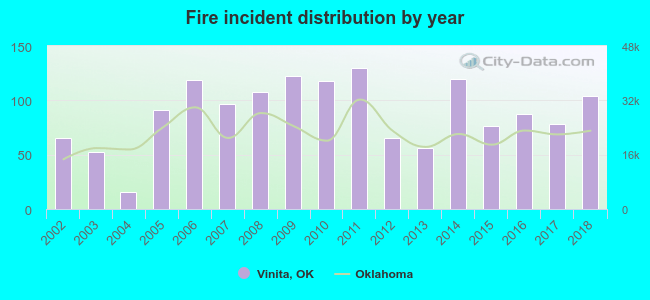 According to the data from the years 2002 - 2018 the average number of fire incidents per year is 88. The highest number of reported fires - 130 took place in 2011, and the least - 16 in 2004. The data has an increasing trend.
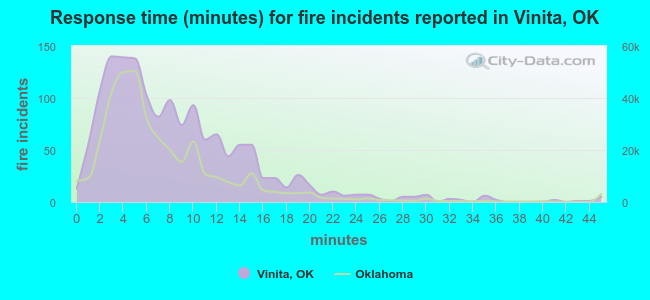 The median response time based on all reported fire incidents is 7 minutes. This is similar to the state median value.
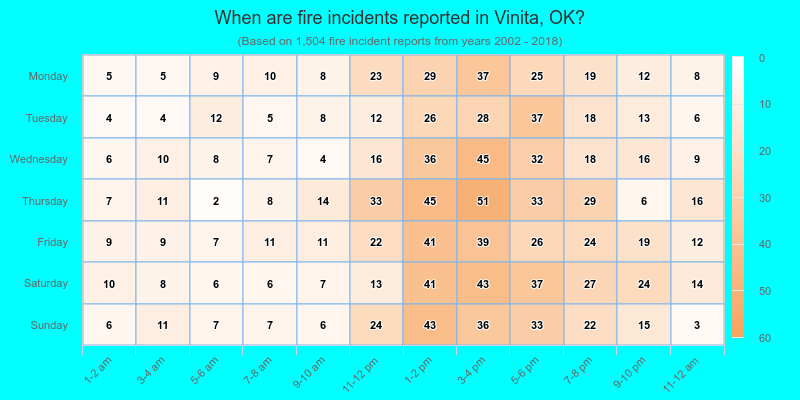
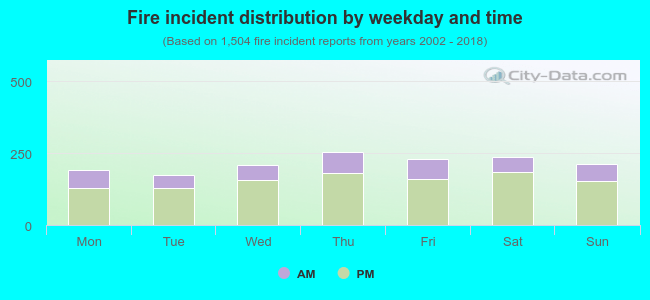 27.3% incidents where reported in the morning and 72.7% in the evening. The most fires (17.0%) took place on Thursday, and the least (11.5%) on Tuesday.
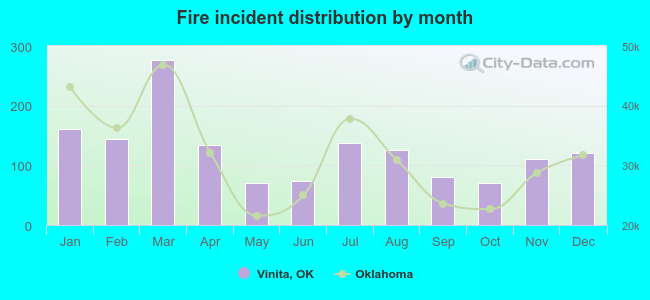 Based on the 1,504 reports from years 2002 - 2018 most fires (18.4%) took place during March, and the least (4.7%) in May.
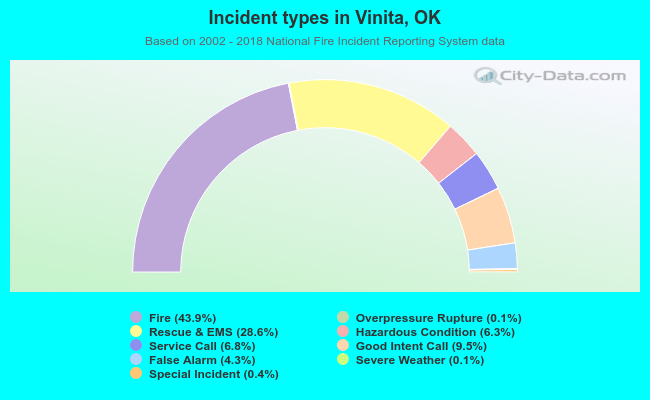 Out of all 3,425 cases reported during the years 2002 - 2018, the most belonged to the categories: Fire (43.9%), Rescue & EMS (28.6%), and Good Intent Call (9.5%).
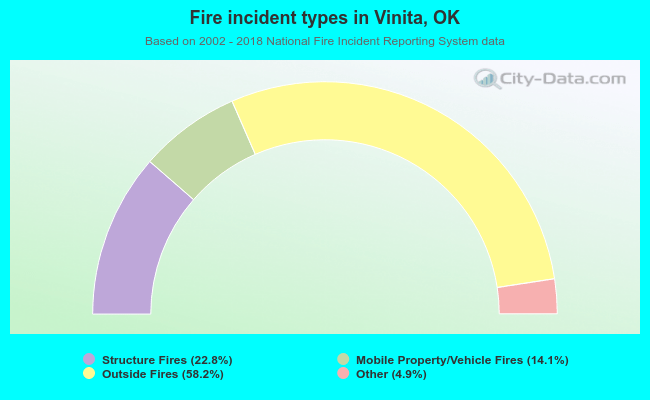 When looking into fire subcategories, the most incidents belonged to: Outside Fires (58.2%), and Structure Fires (22.8%).