Villisca: Fire Incidents, Iowa (IA)
Where are fire incidents reported in Villisca, IA
Something went wrong! Please refresh the page.
|
| |||||||||||||||||||||||||||||||||||||||||||||||||||||||||||||||||||||||||||||||||||||||||||||||||||||||||||||
2002 - 2017 National Fire Incident Reporting System (NFIRS) incidents
- Incident types reported to NFIRS in Villisca, IA
- 19872.0%Fire
- 4315.6%Hazardous Condition
- 165.8%Rescue & EMS
- 72.5%Service Call
- 72.5%False Alarm
- 41.5%Good Intent Call
- Fire incident types reported to NFIRS in Villisca, IA
- 10553.0%Outside Fires
- 4321.7%Structure Fires
- 3417.2%Other
- 168.1%Mobile Property/Vehicle Fires
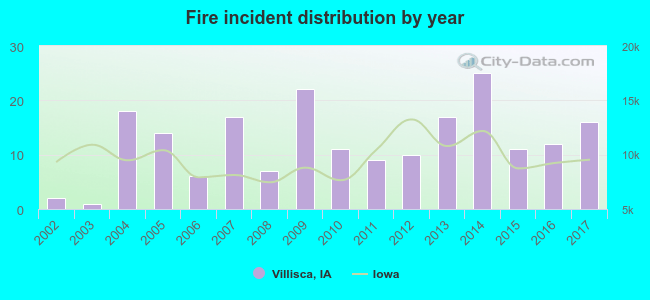 According to the data from the years 2002 - 2017 the average number of fire incidents per year is 12. The highest number of fires - 25 took place in 2014, and the least - 1 in 2003. The data has an increasing trend.
 25.8% incidents where reported in the morning and 74.2% in the evening. The most fires (18.7%) took place on Sunday, and the least (8.1%) on Monday.
 Based on the 198 fires from years 2002 - 2017 most fires (17.7%) took place during March, and the least (4.5%) in May.
 Out of all 275 cases reported during the years 2002 - 2017, the most belonged to the categories: Fire (72.0%), Rescue & EMS (15.6%), and Overpressure Rupture (5.8%).
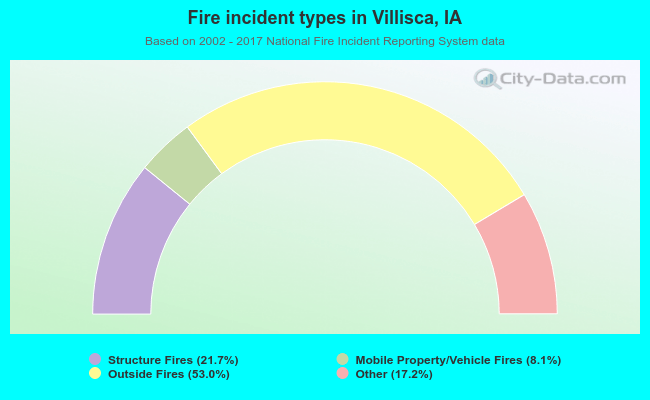 When looking into fire subcategories, the most incidents belonged to: Outside Fires (53.0%), and Structure Fires (21.7%).