Villa Grove: Fire Incidents, Illinois (IL)
Where are fire incidents reported in Villa Grove, IL
Something went wrong! Please refresh the page.
|
| |||||||||||||||||||||||||||||||||||||||||||||||||||||||||||||||||||||||||||||||||||||||||||||||||||||||||||||
| Other | 19 | |||||||||||||||||||||||||||||||||||||||||||||||||||||||||||||||||||||||||||||||||||||||||||||||||||||||||||||
2003 - 2018 National Fire Incident Reporting System (NFIRS) incidents
- Incident types reported to NFIRS in Villa Grove, IL
- 24337.2%Fire
- 16425.1%Rescue & EMS
- 9714.9%Good Intent Call
- 7010.7%Hazardous Condition
- 588.9%Service Call
- 162.5%False Alarm
- 50.8%Severe Weather
- Fire incident types reported to NFIRS in Villa Grove, IL
- 13153.9%Structure Fires
- 7832.1%Outside Fires
- 229.1%Mobile Property/Vehicle Fires
- 124.9%Other
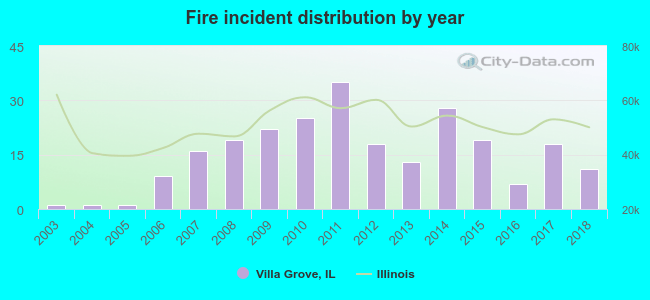 According to the data from the years 2003 - 2018 the average number of fire incidents per year is 15. The highest number of reported fires - 35 took place in 2011, and the least - 1 in 2003. The data has an increasing trend.
 32.1% incidents where reported in the morning and 67.9% in the evening. The most fires (21.4%) took place on Wednesday, and the least (9.9%) on Tuesday.
 According to the 243 incident reports from years 2003 - 2018 most fires (11.9%) took place during August, and the least (2.5%) in December.
 Out of all 653 cases reported during the years 2003 - 2018, the most belonged to the categories: Fire (37.2%), Overpressure Rupture (25.1%), and Service Call (14.9%).
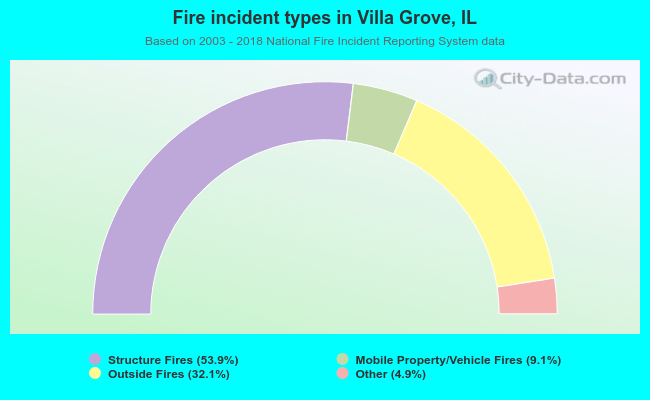 When looking into fire subcategories, the most reports belonged to: Structure Fires (53.9%), and Outside Fires (32.1%).