| Fire incidents reported |
|---|
| Sreet name | Count |
|---|
| I24 | 14 | | MT ZION RD | 10 | | I-24 | 8 | | 6TH ST | 6 | | STATE ROUTE 147 | 6 | | 836 GALEENER STREET | 4 | | BALLOWE CHURCH RD | 4 | | BROWN LN | 4 | | CROSSROADS | 4 | | CROSSROADS RD | 4 | | HWY 45 HWY | 4 | | I-24 WEST BOUND | 4 | | OAK GROVE RD | 4 | | OLD ROUTE 146 LOOP HWY | 4 | | OLD RT 146 LOOP | 4 | | SIXTH ST | 4 | | STATE RT 146 | 4 | | VINE ST | 4 | | I24 WESTBOUND | 2 | | OLD ROUTE 146 LOOP | 2 | | 1001 HESS ST | 2 | | 146 E. & REDBUD RD ST | 2 | | 1540 OLD RT146 LOOP | 2 | | 1540 WILDCAT BLUFF RD | 2 | | 1550 STATE ROUTE 146 E | 2 |
| | | Fire incidents reported |
|---|
| Sreet name | Count |
|---|
| 1610 HOUND DOG RIDGE ROAD | 2 | | 1770 MT SHELTER RD | 2 | | 1800 BEREA CHURCH ROAD | 2 | | 185 OLD RT 146 LOOP | 2 | | 1ST. ST | 2 | | 20 CASEY SPRINGS RD | 2 | | 20 HONEYSUCKLE LN | 2 | | 2545 BALLOWE CHURCH ROAD | 2 | | 2715 PRICE LN | 2 | | 301 NORTH 1ST STREET | 2 | | 303 CIRCLE DRIVE | 2 | | 305 SOUTH 5TH STREET | 2 | | 307 CIRCLE DR | 2 | | 3215 OLD METROPOLIS ROAD | 2 | | 360 OAK GROVE RD | 2 | | 408 NORTH 1ST ST | 2 | | 410 COURT ST ST | 2 | | 410 LEWIS | 2 | | 414 NORTH 5TH STREET | 2 | | 417 POPLAR ST | 2 | | 417 POPLAR STREET | 2 | | 4875 STATE RT 146 EAST | 2 | | 4TH | 2 | | 4TH ST | 2 | | |
|
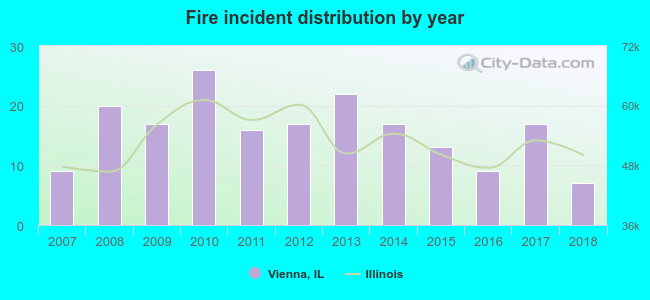 According to the data from the years 2007 - 2018 the average number of fire incidents per year is 16. The highest number of reported fires - 26 took place in 2010, and the least - 7 in 2018. The data has a decreasing trend.
 27.9% incidents where reported in the morning and 72.1% in the evening. The most fires (18.4%) took place on Sunday, and the least (10.5%) on Thursday.
 According to the 190 incident reports from years 2007 - 2018 most fires (16.8%) took place during January, and the least (2.1%) in May.
 Out of all 365 cases reported during the years 2007 - 2018, the most belonged to the categories: Fire (52.1%), Overpressure Rupture (28.2%), and Rescue & EMS (8.5%).
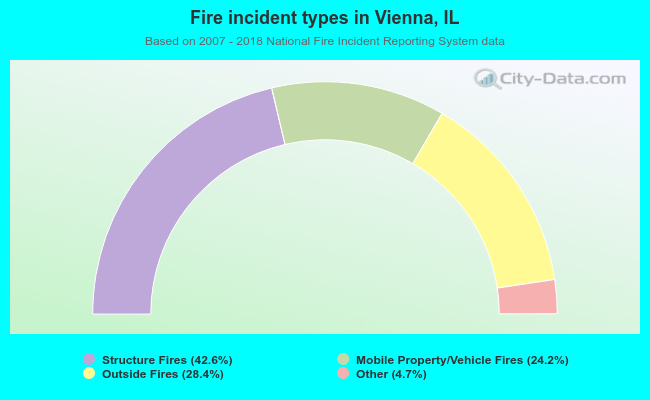 When looking into fire subcategories, the most reports belonged to: Structure Fires (42.6%), and Outside Fires (28.4%).