Vidor: Fire Incidents, Texas (TX)
Where are fire incidents reported in Vidor, TX
Something went wrong! Please refresh the page.
| Fire incidents reported | |
|---|---|
| Sreet name | Count |
| MAIN ST | 554 |
| IH10 | 366 |
| TRAM | 256 |
| HWY 105 | 226 |
| HWY 1131 | 220 |
| HWY 12 | 210 |
| RAILROAD AVE | 200 |
| OLD HWY 90 | 152 |
| ARCHIE | 144 |
| LINSCOMB | 130 |
| ORANGE | 130 |
| FREEWAY BLVD | 124 |
| TANNAHILL | 102 |
| DENVER | 100 |
| FREEWAY | 98 |
| DAVIS | 94 |
| HWY 1132 | 90 |
| HWY 90 | 86 |
| CONCORD | 84 |
| NORTH | 84 |
| COURTLAND | 82 |
| BOLIVAR | 74 |
| SUTTON | 68 |
| TERRY RD | 68 |
| CIRCLE DR | 66 |
| EVANGELINE | 66 |
| GREATHOUSE | 64 |
| MANSFIELD FERRY RD | 64 |
| PINE | 62 |
| TIMBERLANE | 60 |
| Other | 1,632 |
2002 - 2018 National Fire Incident Reporting System (NFIRS) incidents
- Incident types reported to NFIRS in Vidor, TX
- 15,05151.9%Rescue & EMS
- 5,75619.8%Fire
- 3,09910.7%Hazardous Condition
- 2,4778.5%Service Call
- 2,1817.5%Good Intent Call
- 4181.4%False Alarm
- Fire incident types reported to NFIRS in Vidor, TX
- 3,92168.1%Outside Fires
- 1,24721.7%Structure Fires
- 5349.3%Mobile Property/Vehicle Fires
- 540.9%Other
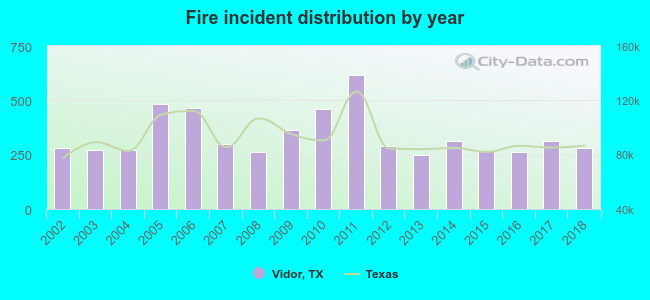 According to the data from the years 2002 - 2018 the average number of fire incidents per year is 339. The highest number of reported fire incidents - 616 took place in 2011, and the least - 250 in 2013. The data has an increasing trend.
The average number of yearly fire incidents per 10k residents in Vidor, TX compared to nearest cities:
(Note: Based on data for the last 3 years, including only cities with population 5,000 and above)
| Vidor: | 261.3 |
| Beaumont: | 45.4 |
| Port Neches: | 43.6 |
| Nederland: | 62.2 |
| Bridge City: | 86.7 |
| Groves: | 63.1 |
| Orange: | 82.5 |
| Lumberton: | 3.5 |
| Port Arthur: | 65.2 |
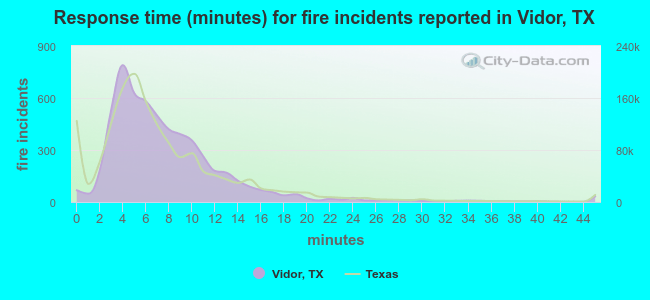 The median response time based on all reported fire incidents is 7 minutes. This is about the same as the state median value.
The median response time in Vidor, TX compared to nearest cities:
(Note: Based on data for all years, including only cities with at least 500 fire incidents)
| Vidor: | 7 minutes |
| Beaumont: | 4 minutes |
| Port Neches: | 5 minutes |
| Nederland: | 5 minutes |
| Bridge City: | 8 minutes |
| Groves: | 4 minutes |
| Orange: | 5 minutes |
| Lumberton: | 8 minutes |
| Port Arthur: | 4 minutes |
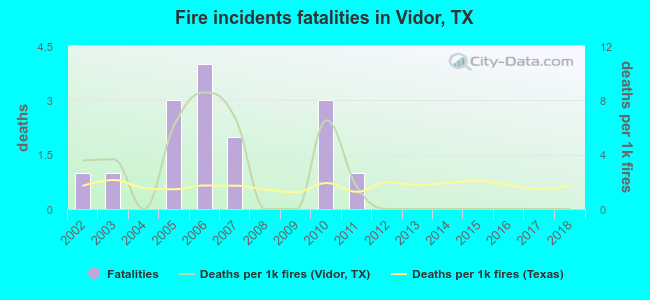 Based on the data from the years 2002 - 2018 the average number of fire-related fatalities per year is 1. The highest number of reported deaths - 4 took place in 2006, and the lowest - 0 in 2004. The data has a decreasing trend.
The average number of deaths per 1,000 fire incidents is 2. This indicator was the highest - 9 in 2006, and the lowest 0 in 2004. The trend for deaths per 1,000 fire incidents is declining. Compared to the Texas value the number of fatalities per 1,000 fires is higher.
Based on the data from the years 2002 - 2018 the average number of fire-related fatalities per year is 1. The highest number of reported deaths - 4 took place in 2006, and the lowest - 0 in 2004. The data has a decreasing trend.
The average number of deaths per 1,000 fire incidents is 2. This indicator was the highest - 9 in 2006, and the lowest 0 in 2004. The trend for deaths per 1,000 fire incidents is declining. Compared to the Texas value the number of fatalities per 1,000 fires is higher.Deaths per 1,000 incidents in Vidor, TX compared to nearest cities:
(Note: Based on data for all years, including only cities with at least 2,500 fire incidents)
| Vidor: | 2.6 |
| Beaumont: | 3.0 |
| Orange: | 2.6 |
| Port Arthur: | 1.5 |
| Jasper: | 4.1 |
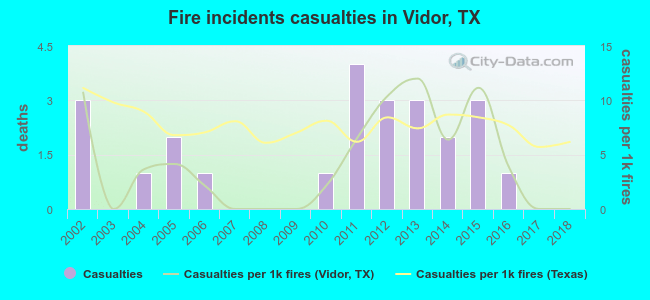 Based on the data from the years 2002 - 2018 the average number of fire-related yearly casualties is 1. The highest number of casualties - 4 took place in 2011, and the lowest - 0 in 2003. The data has a declining trend.
The average number of injuries per 1,000 fires is 4. This indicator was the highest - 12 in 2013, and the lowest 0 in 2003. The trend for casualties per 1,000 fires is dropping. Compared to the state value the number of casualties per 1,000 fire incidents is lower.
Based on the data from the years 2002 - 2018 the average number of fire-related yearly casualties is 1. The highest number of casualties - 4 took place in 2011, and the lowest - 0 in 2003. The data has a declining trend.
The average number of injuries per 1,000 fires is 4. This indicator was the highest - 12 in 2013, and the lowest 0 in 2003. The trend for casualties per 1,000 fires is dropping. Compared to the state value the number of casualties per 1,000 fire incidents is lower.Casualties per 1,000 incidents in Vidor, TX compared to nearest cities:
(Note: Based on data for all years, including only cities with at least 500 fire incidents)
| Vidor: | 4.2 |
| Beaumont: | 22.3 |
| Port Neches: | 10.4 |
| Nederland: | 11.5 |
| Bridge City: | 0.6 |
| Groves: | 8.5 |
| Orange: | 6.8 |
| Lumberton: | 1.5 |
| Port Arthur: | 5.5 |
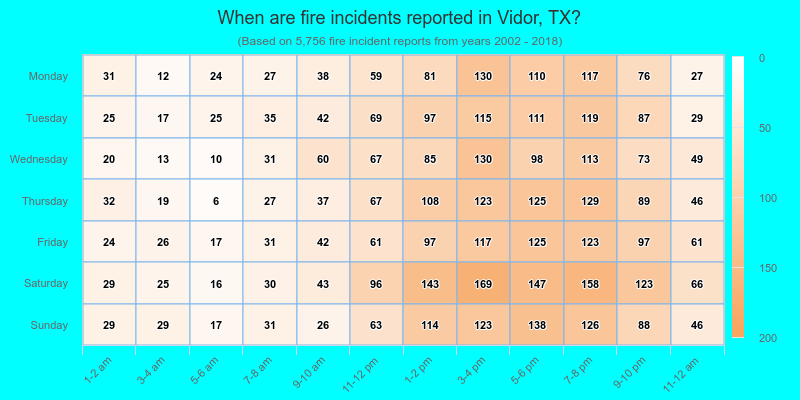
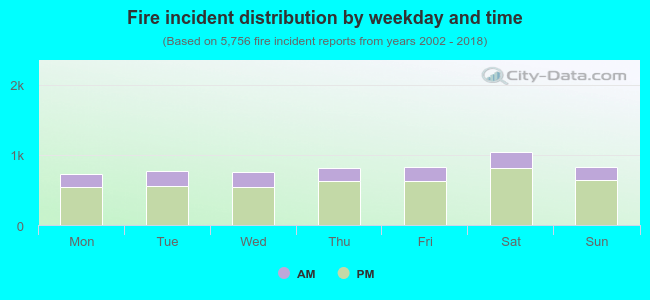 24.8% incidents where reported in the morning and 75.2% in the evening. The most fires (18.2%) took place on Saturday, and the least (12.7%) on Monday.
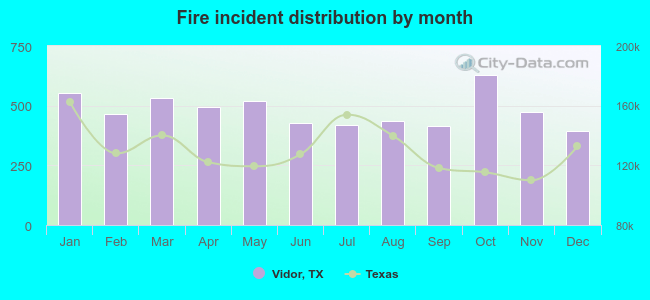 According to the 5,756 fires from years 2002 - 2018 most fires (10.9%) took place during October, and the least (6.8%) in December.
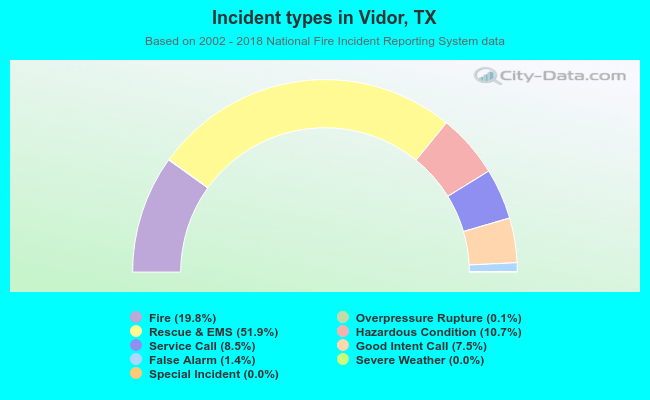 Out of all 29,024 cases reported during the years 2002 - 2018, the most belonged to the categories: Rescue & EMS (51.9%), Fire (19.8%), and Hazardous Condition (10.7%).
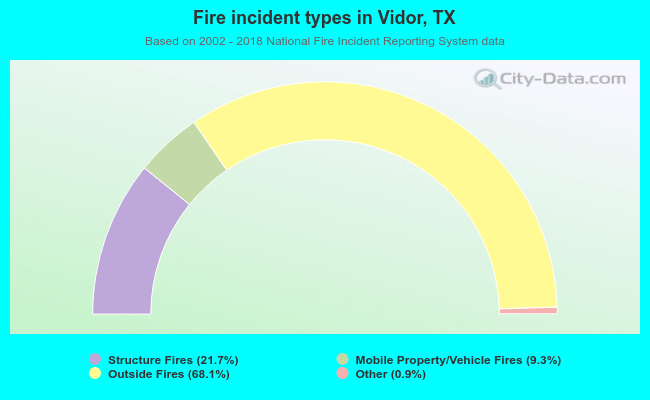 When looking into fire subcategories, the most incidents belonged to: Outside Fires (68.1%), and Structure Fires (21.7%).