Vidalia: Fire Incidents, Louisiana (LA)
Where are fire incidents reported in Vidalia, LA
Something went wrong! Please refresh the page.
|
| |||||||||||||||||||||||||||||||||||||||||||||||||||||||||||||||||||||||||||||||||||||||||||||||||||||||||||||
2002 - 2018 National Fire Incident Reporting System (NFIRS) incidents
- Incident types reported to NFIRS in Vidalia, LA
- 24937.7%Fire
- 17726.8%Hazardous Condition
- 11116.8%Rescue & EMS
- 629.4%False Alarm
- 375.6%Good Intent Call
- 203.0%Service Call
- 50.8%Overpressure Rupture
- Fire incident types reported to NFIRS in Vidalia, LA
- 10241.0%Structure Fires
- 9036.1%Outside Fires
- 5321.3%Mobile Property/Vehicle Fires
- 41.6%Other
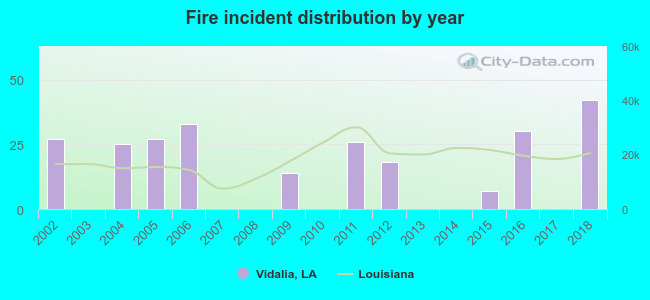 According to the data from the years 2002 - 2018 the average number of fires per year is 15. The highest number of fires - 42 took place in 2018, and the least - 0 in 2003. The data has a growing trend.
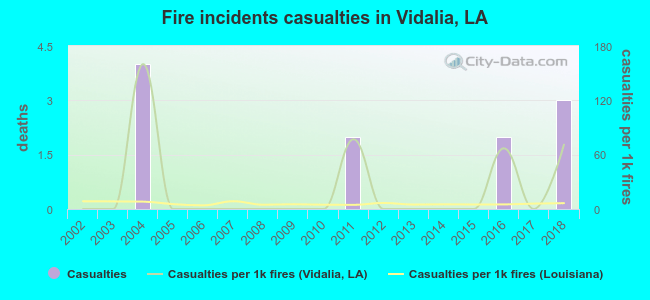 According to the reports from the years 2002 - 2018 the average number of fire-related yearly casualties is 1. The highest number of reported injuries - 4 took place in 2004, and the lowest - 0 in 2002. The data has a growing trend.
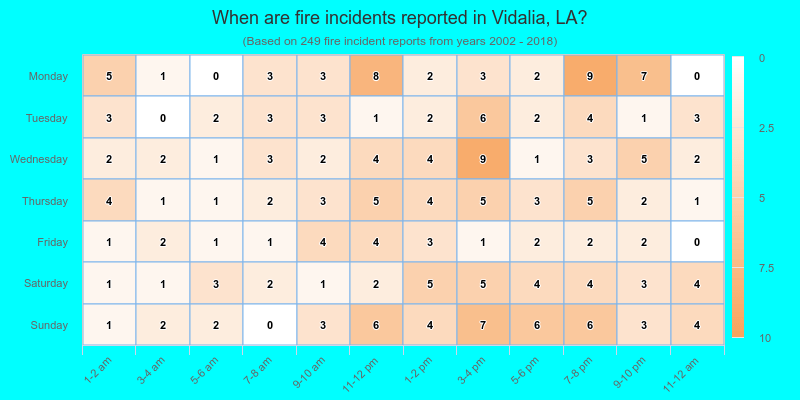
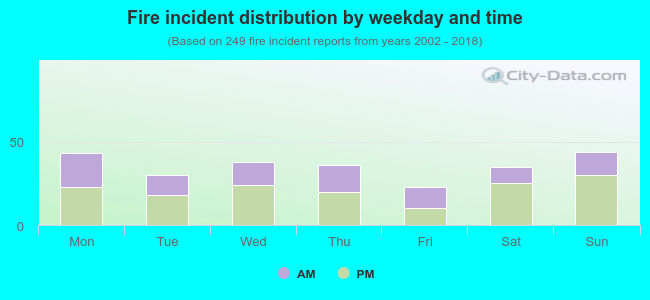 39.8% incidents where reported in the morning and 60.2% in the evening. The most fires (17.7%) took place on Sunday, and the least (9.2%) on Friday.
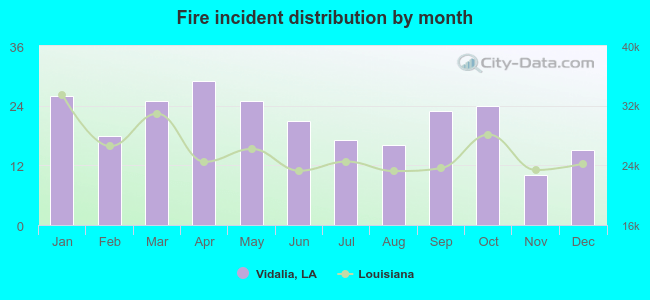 According to the 249 fires from years 2002 - 2018 most fires (11.6%) took place during April, and the least (4.0%) in November.
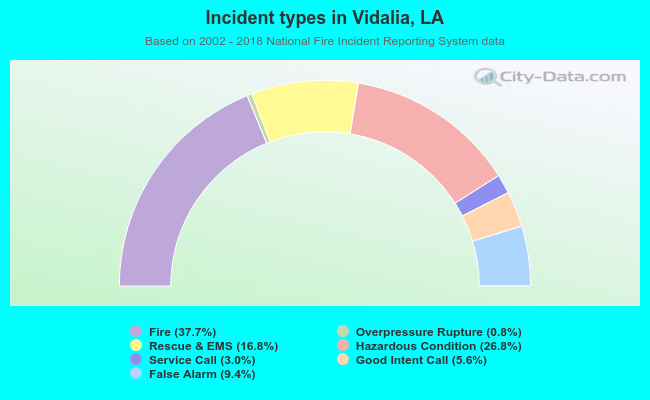 Out of all 661 cases reported during the years 2002 - 2018, the most belonged to the categories: Fire (37.7%), Hazardous Condition (26.8%), and Rescue & EMS (16.8%).
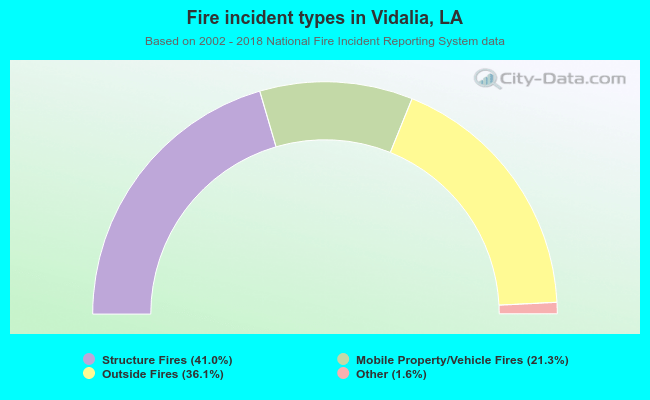 When looking into fire subcategories, the most incidents belonged to: Structure Fires (41.0%), and Outside Fires (36.1%).