Verona: Fire Incidents, Pennsylvania (PA)
Where are fire incidents reported in Verona, PA
Something went wrong! Please refresh the page.
|
| |||||||||||||||||||||||||||||||||||||||||||||||||||||||||||||||||||||||||||||||||||||||||||||||||||||||||||||
2004 - 2018 National Fire Incident Reporting System (NFIRS) incidents
- Incident types reported to NFIRS in Verona, PA
- 35227.8%Rescue & EMS
- 31424.8%Hazardous Condition
- 29223.1%Fire
- 13911.0%Good Intent Call
- 1209.5%False Alarm
- 362.8%Service Call
- 80.6%Severe Weather
- 20.2%Special Incident
- Fire incident types reported to NFIRS in Verona, PA
- 14650.0%Structure Fires
- 6421.9%Other
- 4916.8%Outside Fires
- 3311.3%Mobile Property/Vehicle Fires
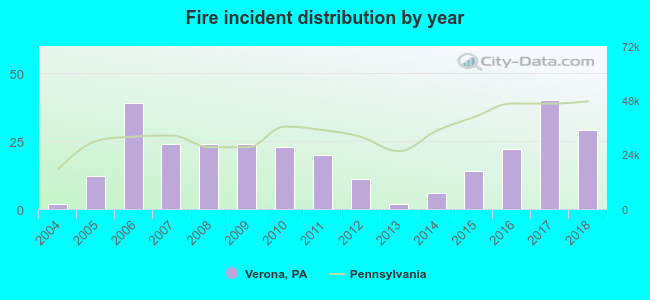 Based on the data from the years 2004 - 2018 the average number of fires per year is 19. The highest number of reported fires - 40 took place in 2017, and the least - 2 in 2004. The data has an increasing trend.
 According to the reports from the years 2004 - 2018 the average number of fire-related yearly casualties is 0. The highest number of injuries - 3 took place in 2008, and the lowest - 0 in 2004. The data has a constant trend.
 25.7% incidents where reported in the morning and 74.3% in the evening. The most fires (18.2%) took place on Saturday, and the least (11.6%) on Sunday.
 According to the 292 fire incident reports from years 2004 - 2018 most fires (11.0%) took place during March, and the least (4.8%) in June.
 Out of all 1,264 cases reported during the years 2004 - 2018, the most belonged to the categories: Rescue & EMS (27.8%), Hazardous Condition (24.8%), and Fire (23.1%).
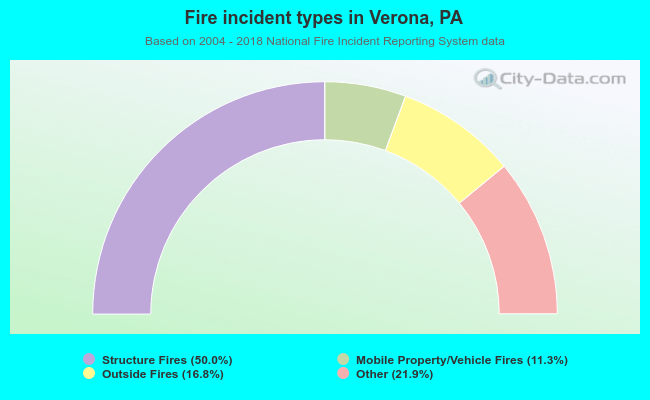 When looking into fire subcategories, the most incidents belonged to: Structure Fires (50.0%), and Other (21.9%).