| Fire incidents reported |
|---|
| Sreet name | Count |
|---|
| 1300 KLEIN STREET | 10 | | 1201 MCKINLEY AVE | 8 | | LINCOLN | 8 | | ROBIN ST | 8 | | 1250 KLEIN ST | 6 | | 400 MAIN ST | 6 | | 700 BLOCK OF BROWN ST | 6 | | MARKET ST | 6 | | MEREDOCIA | 6 | | THIRD ST | 6 | | 108 110 112 ABBOTT ST | 4 | | 1239 ORIOLE ST | 4 | | 1305 ORIOLE STREET | 4 | | 206 ABBOTT ST | 4 | | 210 KERR STREET | 4 | | 425 LINCOLN | 4 | | 440 LINCOLN STREET | 4 | | 507 JEFFERSON | 4 | | 522 3RD ST | 4 | | ABBOTT ST | 4 | | BREMAN ST UNDER MCKINLEY BRID BRG | 4 | | BROADWAY | 4 | | BROADWAY AVE | 4 | | BROWN ST | 4 | | KLEIN | 4 |
| | | Fire incidents reported |
|---|
| Sreet name | Count |
|---|
| MARKET | 4 | | MCKINLEY BRIDGE | 4 | | MERCHANT HI-LINE ROAD | 4 | | ORIOLE | 4 | | RT 3 AND MCKINLEY BRIDGE BRG | 4 | | 100 BLOCK ABBOTT | 2 | | 100 GRANVILLE STREET | 2 | | 100 KERR STREET | 2 | | 100 MCKINLEY | 2 | | 1000 BLOCK OF COLLEGE ST | 2 | | 1000 KLEIN AVE LGTS | 2 | | 1000 KLIEN | 2 | | 1001COLLEGE AVE. | 2 | | 1004 JAMES RAY | 2 | | 1006 MARKET ST. | 2 | | 1015 LOGAN ST | 2 | | 1018 2ND ST | 2 | | 1018 SECOND STREET | 2 | | 1023 BROADWAY ST | 2 | | 108110 112 ABBOTT ST | 2 | | 110 ABBOTT ST | 2 | | 1100 BLOCK CALHOUN ST | 2 | | 1101 7TH ST | 2 | | 1101 S 4TH ST ST | 2 | | |
|
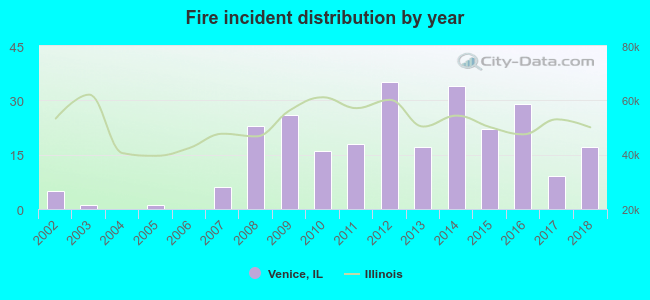 According to the data from the years 2002 - 2018 the average number of fire incidents per year is 15. The highest number of reported fires - 35 took place in 2012, and the least - 0 in 2004. The data has an increasing trend.
 39.4% incidents where reported in the morning and 60.6% in the evening. The most fires (15.8%) took place on Monday, and the least (12.4%) on Wednesday.
 According to the 259 reports from years 2002 - 2018 most fires (14.7%) took place during January, and the least (4.2%) in June.
 Out of all 385 cases reported during the years 2002 - 2018, the most belonged to the categories: Fire (67.3%), Hazardous Condition (15.3%), and Rescue & EMS (8.1%).
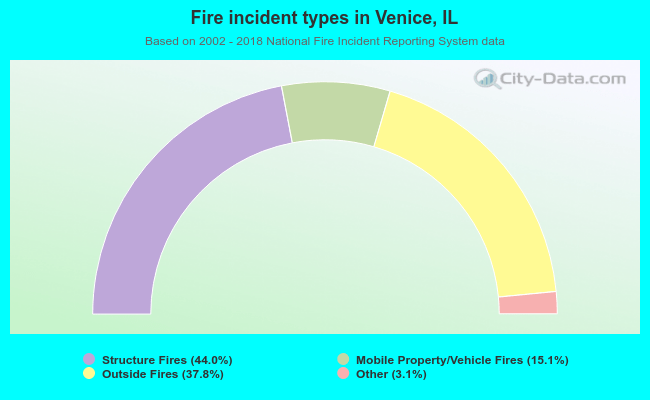 When looking into fire subcategories, the most incidents belonged to: Structure Fires (44.0%), and Outside Fires (37.8%).