Veneta: Fire Incidents, Oregon (OR)
Where are fire incidents reported in Veneta, OR
Something went wrong! Please refresh the page.
|
| |||||||||||||||||||||||||||||||||||||||||||||||||||||||||||||||||||||||||||||||||||||||||||||||||||||||||||||
2002 - 2015 National Fire Incident Reporting System (NFIRS) incidents
- Incident types reported to NFIRS in Veneta, OR
- 90854.6%Rescue & EMS
- 33119.9%Fire
- 17010.2%Good Intent Call
- 1287.7%Service Call
- 965.8%Hazardous Condition
- 261.6%False Alarm
- 20.1%Special Incident
- Fire incident types reported to NFIRS in Veneta, OR
- 13841.7%Structure Fires
- 12537.8%Outside Fires
- 5115.4%Mobile Property/Vehicle Fires
- 175.1%Other
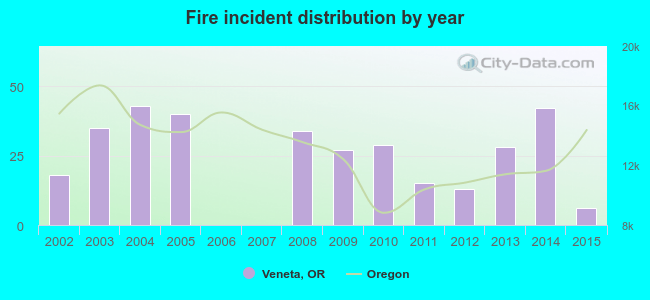 According to the data from the years 2002 - 2015 the average number of fire incidents per year is 24. The highest number of reported fire incidents - 43 took place in 2004, and the least - 0 in 2006. The data has a dropping trend.
 Based on the data from the years 2002 - 2015 the average number of fire-related yearly casualties is 1. The highest number of reported injuries - 3 took place in 2012, and the lowest - 0 in 2002. The data has a constant trend.
 39.0% incidents where reported in the morning and 61.0% in the evening. The most fires (19.6%) took place on Saturday, and the least (10.0%) on Tuesday.
 According to the 331 fire incidents from years 2002 - 2015 most fires (13.6%) took place during July, and the least (4.5%) in September.
 Out of all 1,662 cases reported during the years 2002 - 2015, the most belonged to the categories: Rescue & EMS (54.6%), Fire (19.9%), and Good Intent Call (10.2%).
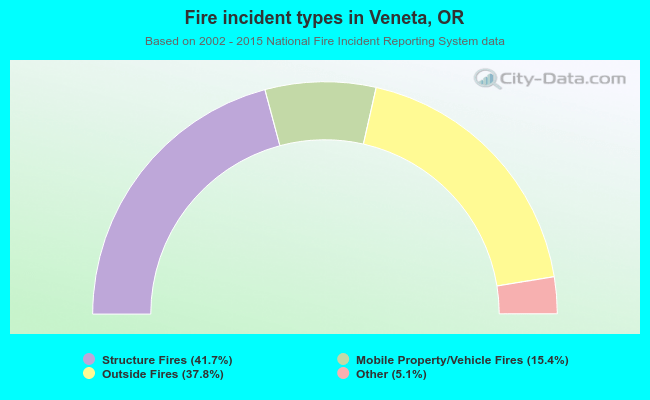 When looking into fire subcategories, the most reports belonged to: Structure Fires (41.7%), and Outside Fires (37.8%).