| Fire incidents reported |
|---|
| Sreet name | Count |
|---|
| RT. 2 | 42 | | HC73 | 16 | | RT 2 | 16 | | KY 59 | 8 | | RT 1 TOLLESBORO | 8 | | MANLEY HOLLOW | 6 | | 13103 KY 59 | 4 | | 138 CEDAR GROVE CHURCH RD | 4 | | 1423 LAUREL CREEK ROAD | 4 | | 16940 KY 59 | 4 | | 258 SAND HILL SPUR | 4 | | 2896 ROCK RUN RD | 4 | | 5126 KY 59 | 4 | | 58 EASTHAM ST | 4 | | 6065 SALT LICK RAOD | 4 | | 77 BEL AIR DR | 4 | | 78 SLATE CHURCH RD | 4 | | ALUM ROCK RIDGE ROAD | 4 | | CHALK RIDGE | 4 | | CONCORD | 4 | | HWY 9 | 4 | | KY 377 HWY | 4 | | OAK RIDGE ROAD | 4 | | OLD TRACE ROAD | 4 | | POLLITT LANE | 4 |
| | | Fire incidents reported |
|---|
| Sreet name | Count |
|---|
| QUICKS RUN | 4 | | RT 2 VANCEBURG | 4 | | SALT LICK | 4 | | SAND HILL | 4 | | TAR FORK | 4 | | TRACE CREEK | 4 | | 11123 KY 59 | 2 | | 102 TOWN BR RD | 2 | | 10491 KY 59 | 2 | | 108 JACKSON STREET | 2 | | 1083 BURTONVILLE ROAD | 2 | | 10956 KY 59 | 2 | | 111 OLD RT 10 RD | 2 | | 112 HAMILTON BR | 2 | | 112 SECOND STREET | 2 | | 11410 SALT LICK ROAD | 2 | | 1159 STRAIGHT FORK RD | 2 | | 118 CAMP LANE | 2 | | 118 ROCK RUN RD | 2 | | 11820 KY 344 | 2 | | 11894 KY 344 | 2 | | 1237& DAVIS LANE | 2 | | 12544 KY 344 | 2 | | 128 BLUE WATERS DR | 2 | | |
|
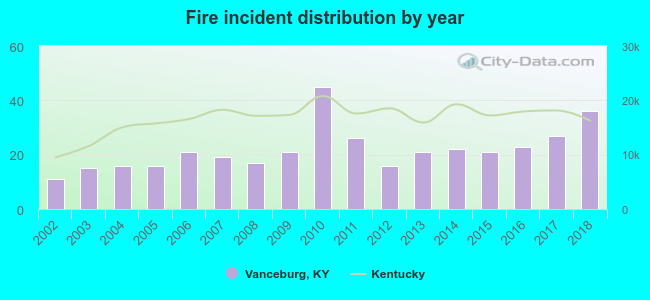 Based on the data from the years 2002 - 2018 the average number of fires per year is 22. The highest number of reported fire incidents - 45 took place in 2010, and the least - 11 in 2002. The data has a growing trend.
 35.7% incidents where reported in the morning and 64.3% in the evening. The most fires (19.6%) took place on Monday, and the least (10.7%) on Thursday.
 According to the 373 reports from years 2002 - 2018 most fires (13.1%) took place during March, and the least (2.9%) in August.
 Out of all 812 cases reported during the years 2002 - 2018, the most belonged to the categories: Fire (45.9%), Rescue & EMS (33.3%), and Good Intent Call (8.4%).
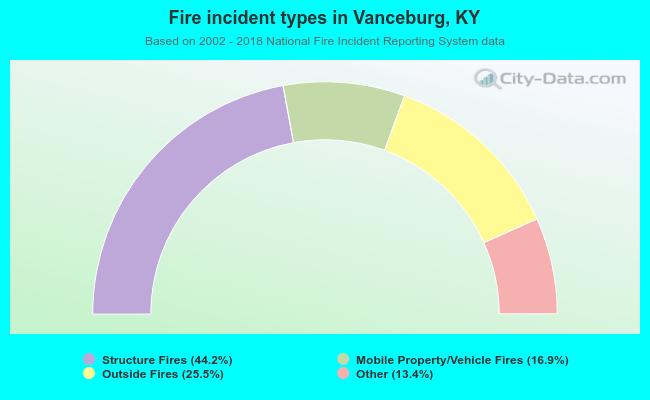 When looking into fire subcategories, the most incidents belonged to: Structure Fires (44.2%), and Outside Fires (25.5%).