Upland: Fire Incidents, Pennsylvania (PA)
Where are fire incidents reported in Upland, PA
Something went wrong! Please refresh the page.
|
| |||||||||||||||||||||||||||||||||||||||||||||||||||||||||||||||||||||||||||||||||||||||||||||||||||||||||||||
2004 - 2018 National Fire Incident Reporting System (NFIRS) incidents
- Incident types reported to NFIRS in Upland, PA
- 19924.8%Fire
- 19924.8%Special Incident
- 13116.3%Hazardous Condition
- 11013.7%Good Intent Call
- 799.8%False Alarm
- 637.8%Rescue & EMS
- 212.6%Service Call
- 10.1%Overpressure Rupture
- 10.1%Severe Weather
- Fire incident types reported to NFIRS in Upland, PA
- 17185.9%Structure Fires
- 147.0%Outside Fires
- 84.0%Other
- 63.0%Mobile Property/Vehicle Fires
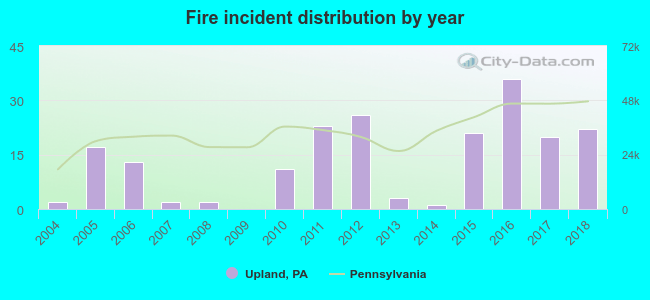 According to the data from the years 2004 - 2018 the average number of fire incidents per year is 13. The highest number of reported fire incidents - 36 took place in 2016, and the least - 0 in 2009. The data has a growing trend.
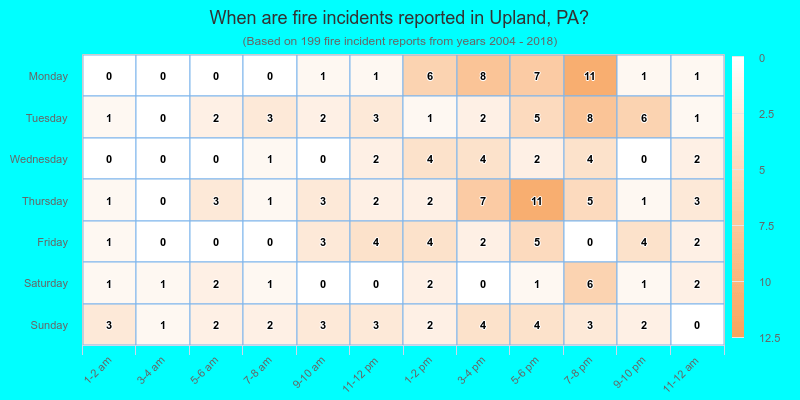
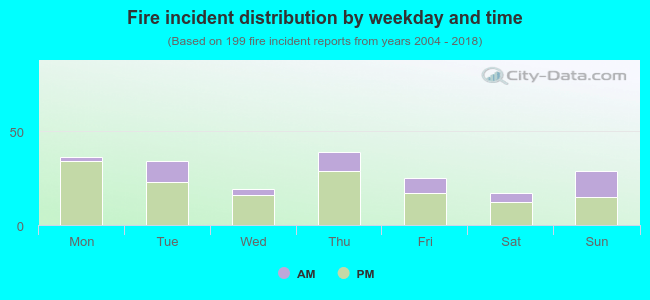 26.6% incidents where reported in the morning and 73.4% in the evening. The most fires (19.6%) took place on Thursday, and the least (8.5%) on Saturday.
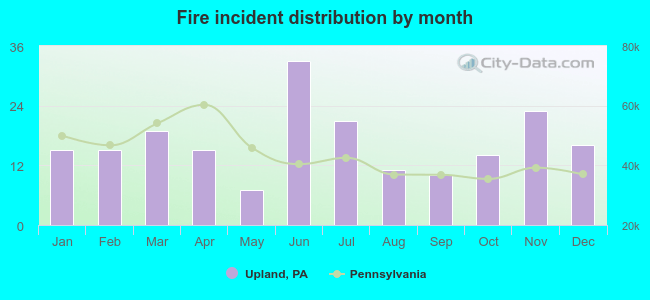 According to the 199 fire incidents from years 2004 - 2018 most fires (16.6%) took place during June, and the least (3.5%) in May.
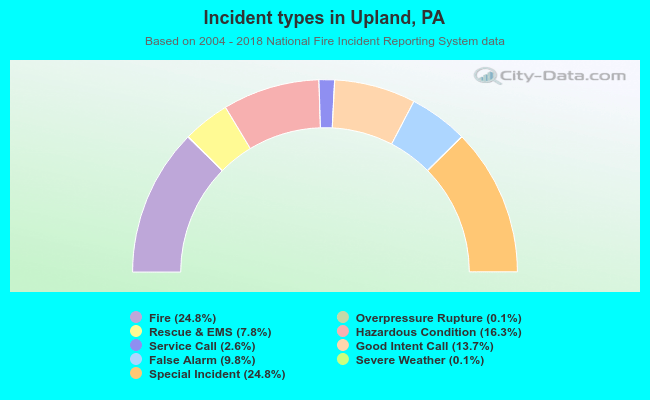 Out of all 804 cases reported during the years 2004 - 2018, the most belonged to the categories: Fire (24.8%), Special Incident (24.8%), and Hazardous Condition (16.3%).
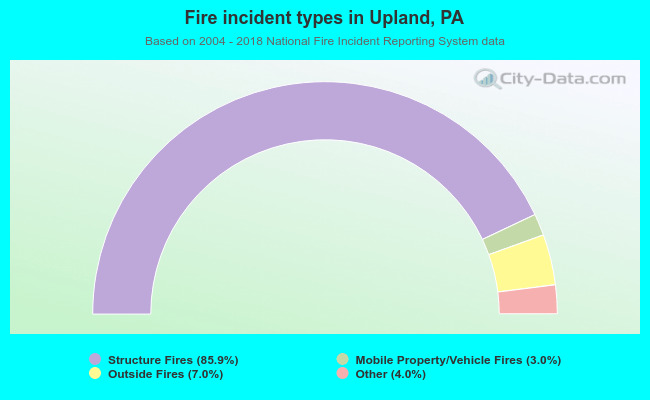 When looking into fire subcategories, the most incidents belonged to: Structure Fires (85.9%), and Outside Fires (7.0%).