| Fire incidents reported |
|---|
| Sreet name | Count |
|---|
| HORSE BRANCH RD | 42 | | PUDDIN SWAMP RD | 36 | | TURBEVILLE HWY | 36 | | CLARENCE COKER HWY | 30 | | OLANTA HWY | 20 | | SANDHILL RD | 20 | | AMERICAN AVE | 16 | | BOB WHITE RD | 14 | | WILLIAM GIBBONS RD | 14 | | HICKS RD | 12 | | JIMMY ST | 12 | | MICKEY ST | 12 | | SELOC RD | 12 | | SMITH ST | 12 | | PUDDING SWAMP RD | 10 | | JAMES RD | 8 | | POPE ST | 8 | | 4059 PUDDIN SWAMP ROAD | 6 | | LEGION RD | 6 | | MAIN ST | 6 | | OLIVE GROVE RD | 6 | | SALEM RD | 6 | | SHILOH RD | 6 | | SHORT CUT RD | 6 | | SLOANE ST | 6 |
| | | Fire incidents reported |
|---|
| Sreet name | Count |
|---|
| WATTS RD | 6 | | WILLIE COKER RD | 6 | | 1028 HICKORY HILL ROAD | 4 | | ANN WORSHAM RD | 4 | | ARMATO LN | 4 | | BURNT BRANCH ROAD | 4 | | CAM ST | 4 | | COKER ST | 4 | | FARMINGTON RD | 4 | | FARMWOOD CIR | 4 | | HICKS ROAD | 4 | | HWY 378 | 4 | | HWY 527 | 4 | | HWY. 378 | 4 | | MAIN STREET | 4 | | MORRIS ST | 4 | | POWELL CIR | 4 | | 1000 GAMBLE STREET | 2 | | 1008 WILLOW LANE | 2 | | 1023 IRIS DRIVE | 2 | | 1023 POLO DR. | 2 | | 1023 POPE STREET | 2 | | 1050 IRIS LANE | 2 | | 1058 SUNSHINE ACRES | 2 | | |
|
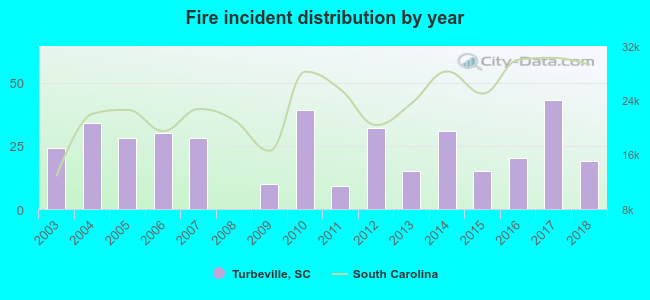 Based on the data from the years 2003 - 2018 the average number of fires per year is 24. The highest number of reported fire incidents - 43 took place in 2017, and the least - 0 in 2008. The data has a dropping trend.
 23.6% incidents where reported in the morning and 76.4% in the evening. The most fires (21.2%) took place on Saturday, and the least (8.8%) on Tuesday.
 According to the 377 fire incidents from years 2003 - 2018 most fires (17.0%) took place during March, and the least (5.0%) in August.
 Out of all 835 cases reported during the years 2003 - 2018, the most belonged to the categories: Fire (45.1%), Overpressure Rupture (28.7%), and Rescue & EMS (11.0%).
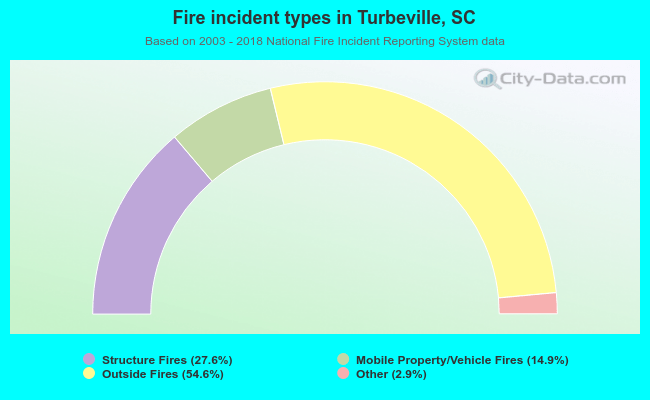 When looking into fire subcategories, the most incidents belonged to: Outside Fires (54.6%), and Structure Fires (27.6%).