| Fire incidents reported |
|---|
| Sreet name | Count |
|---|
| HWY 229 | 70 | | HOLLY CREEK | 44 | | HOUSE RD. | 42 | | HWY 291 | 32 | | HOUSE ROAD | 28 | | VINE | 22 | | W MAIN | 20 | | HOUSE RD | 18 | | DIXIONVILLE RD | 16 | | MAIN | 16 | | HOLY RIDGE RD | 14 | | HOLLY CREEK RD | 12 | | HAZEL | 10 | | HOLY RIDGE | 10 | | W. MAIN | 10 | | BALDING RD | 8 | | HOLY RIDGE ROAD | 8 | | HOLLY CREEK ROAD | 6 | | HOUSE RD | 6 | | MAIN STREET | 6 | | MARTIN CUTOFF | 6 | | W MAIN ST. | 6 | | WALNUT | 6 | | HOLLY CREEK RD. | 4 | | HOLY RIDGE RD | 4 |
| | | Fire incidents reported |
|---|
| Sreet name | Count |
|---|
| HOLY RIDGE RD. | 4 | | HUTCHENSON LOOP | 4 | | NEW DIXIONVILLE RD | 4 | | OILWELL ROAD | 4 | | OKLAHOMA INN RD | 4 | | OKLAHOMA INN RD. | 4 | | PRICE DR | 4 | | RAILROAD TRAM RD | 4 | | THUNDERBIRD LOOP | 4 | | VINE ST. | 4 | | VINE STREET | 4 | | WEST MAIN | 4 | | 10202 HWY 229 | 2 | | 10401 HWY 229 | 2 | | 118 WALNUT | 2 | | 1227 VINE | 2 | | 1600 BLK W. MAIN | 2 | | 1600 BLK W.MAIN | 2 | | 204 DICICCO TR | 2 | | 2ND ST | 2 | | 3023 W. MAIN | 2 | | 3209 HOLY RIDGE RD | 2 | | 3RD STREET | 2 | | 500 RAILROAD TRAM | 2 | | |
|
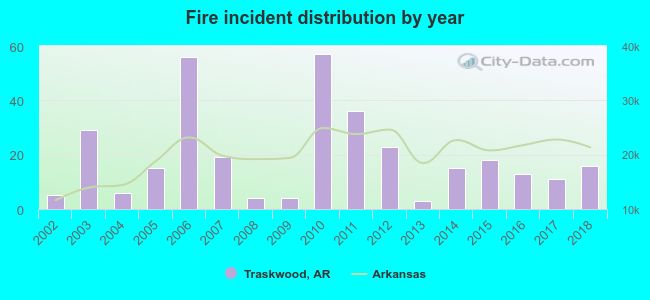 According to the data from the years 2002 - 2018 the average number of fires per year is 19. The highest number of fires - 57 took place in 2010, and the least - 3 in 2013. The data has a rising trend.
 31.2% incidents where reported in the morning and 68.8% in the evening. The most fires (17.6%) took place on Saturday, and the least (8.5%) on Tuesday.
 Based on the 330 incident reports from years 2002 - 2018 most fires (17.0%) took place during January, and the least (3.3%) in September.
 Out of all 678 cases reported during the years 2002 - 2018, the most belonged to the categories: Fire (48.7%), Overpressure Rupture (37.3%), and Service Call (6.3%).
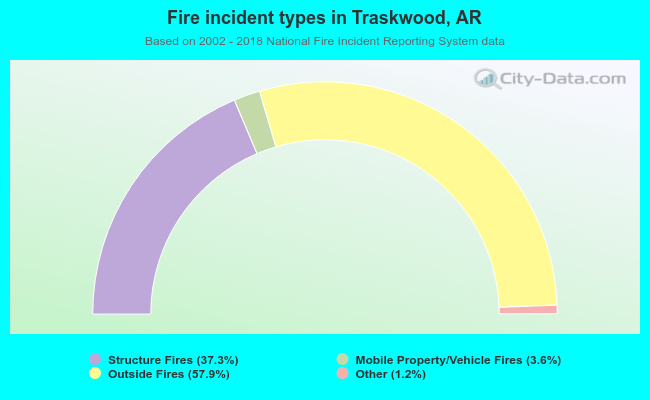 When looking into fire subcategories, the most reports belonged to: Outside Fires (57.9%), and Structure Fires (37.3%).