Trappe: Fire Incidents, Pennsylvania (PA)
Where are fire incidents reported in Trappe, PA
Something went wrong! Please refresh the page.
|
| |||||||||||||||||||||||||||||||||||||||||||||||||||||||||||||||||||||||||||||||||||||||||||||||||||||||||||||
2003 - 2018 National Fire Incident Reporting System (NFIRS) incidents
- Incident types reported to NFIRS in Trappe, PA
- 14921.8%Rescue & EMS
- 13820.1%Hazardous Condition
- 12718.5%Fire
- 10014.6%False Alarm
- 8312.1%Service Call
- 8111.8%Good Intent Call
- 50.7%Special Incident
- 10.1%Overpressure Rupture
- 10.1%Severe Weather
- Fire incident types reported to NFIRS in Trappe, PA
- 7256.7%Structure Fires
- 4132.3%Outside Fires
- 1411.0%Mobile Property/Vehicle Fires
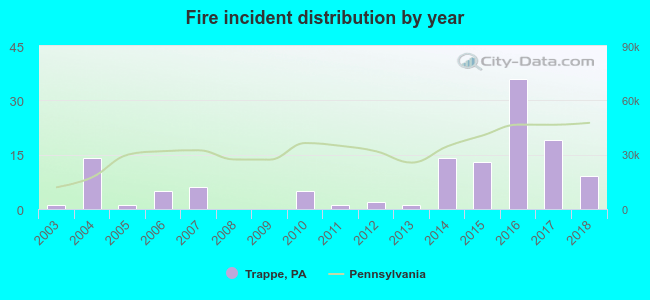 According to the data from the years 2003 - 2018 the average number of fire incidents per year is 8. The highest number of reported fire incidents - 36 took place in 2016, and the least - 0 in 2008. The data has an increasing trend.
 22.8% incidents where reported in the morning and 77.2% in the evening. The most fires (24.4%) took place on Friday, and the least (7.1%) on Tuesday.
 According to the 127 fire incident reports from years 2003 - 2018 most fires (14.2%) took place during March, and the least (3.9%) in June.
 Out of all 685 cases reported during the years 2003 - 2018, the most belonged to the categories: Rescue & EMS (21.8%), Hazardous Condition (20.1%), and Fire (18.5%).
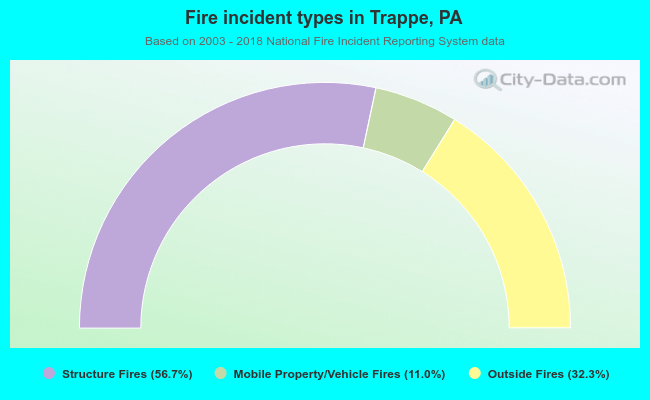 When looking into fire subcategories, the most reports belonged to: Structure Fires (56.7%), and Outside Fires (32.3%).