| Fire incidents reported |
|---|
| Sreet name | Count |
|---|
| MICHIGAN | 20 | | 738 E 500 N | 6 | | 700E 550N | 4 | | BENTON | 4 | | ERIE ST | 4 | | FILLMORE | 4 | | RR 2 BOX 172A | 4 | | RR2 BOX 100 | 4 | | RR2 BOX 148 | 4 | | RR2 BOX 152A | 4 | | SUPERIOR | 4 | | SUPERIOR ST | 4 | | 1/2 MILE E.OF600EON1150N | 2 | | 1/2 MILE N OF750N ON975E | 2 | | 1/2MILE WEST OF800 E 1000N | 2 | | 1/4 MILEEASTOF800EON1000N | 2 | | 1000 E | 2 | | 1000 E 1300 N | 2 | | 1000E 1500N | 2 | | 1000N 700E | 2 | | 101 E FREEMONT | 2 | | 101 S MICHIGAN | 2 | | 1010 N ROAD | 2 | | 1010N 1200E | 2 | | 101W. BENTON | 2 |
| | | Fire incidents reported |
|---|
| Sreet name | Count |
|---|
| 102 N SUPERIOR | 2 | | 102 S HURON | 2 | | 1050N 800E | 2 | | 106 CRADDICK | 2 | | 106 EAST FILLMORE | 2 | | 1066E 900N | 2 | | 107 N MICHIGAN ST | 2 | | 107 NORTH SENECA | 2 | | 1074N 800E | 2 | | 1074N 800E LGTS | 2 | | 1080E 1700N | 2 | | 110 W FILLMORE | 2 | | 1100E 1425N | 2 | | 1100E 1500N | 2 | | 1125E ON 1300N | 2 | | 1125E. 1600N. | 2 | | 1150 NORTH | 2 | | 1175 E 1500 N | 2 | | 1200 N600E | 2 | | 1200E | 2 | | 1200E 900N | 2 | | 1250NORTH 1/2 MILE W OF700EAST | 2 | | 1256 SR HWY 16 | 2 | | 1300N. 1/4 MILE E. OF 1000E. | 2 | | |
|
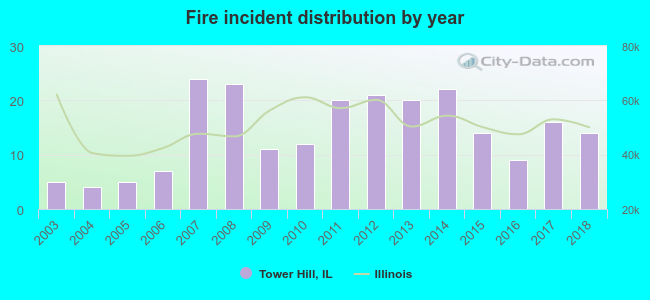 Based on the data from the years 2003 - 2018 the average number of fires per year is 14. The highest number of fire incidents - 24 took place in 2007, and the least - 4 in 2004. The data has an increasing trend.
 31.7% incidents where reported in the morning and 68.3% in the evening. The most fires (17.6%) took place on Sunday, and the least (11.9%) on Monday.
 Based on the 227 incident reports from years 2003 - 2018 most fires (18.5%) took place during March, and the least (3.1%) in June.
 Out of all 619 cases reported during the years 2003 - 2018, the most belonged to the categories: Overpressure Rupture (38.9%), Fire (36.7%), and Service Call (16.5%).
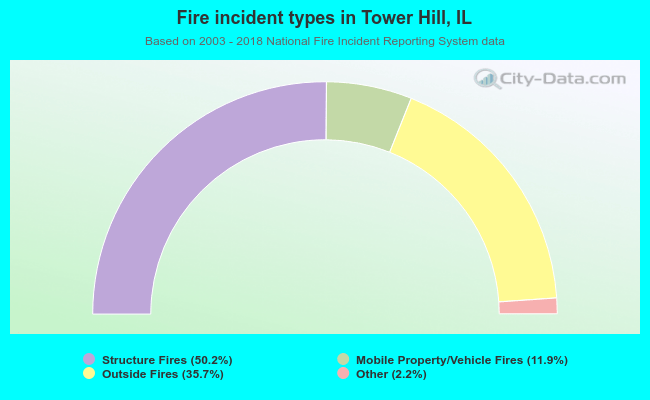 When looking into fire subcategories, the most reports belonged to: Structure Fires (50.2%), and Outside Fires (35.7%).