| Fire incidents reported |
|---|
| Sreet name | Count |
|---|
| GRAND AVE | 30 | | WICONISCO AVE | 20 | | GRAND (66) AVE | 18 | | GRAND AVE | 16 | | ROUTE 325 CLARKS VALLEY R | 12 | | WICONISCO ST | 12 | | GRAND ST | 10 | | EAST GRAND AVE | 6 | | GEORGE ST | 6 | | REINER SCHOOL ROAD | 6 | | WICONISCO (66) AVE | 6 | | CLARKS VALLEY RD | 4 | | FOURTH ST | 4 | | GREENLAND ROAD | 4 | | TEABERRY LANE | 4 | | 14TH ST | 2 | | 1709 E GRAND AVE | 2 | | 17TH STREET | 2 | | 1820 E WICONISCO ST | 2 | | 1820 EAST WICONISCO ST | 2 | | 266 CLARKS VALLEY RD | 2 | | 350 DEITRICH AVE | 2 | | 4TH ST | 2 | | 4TH STREET | 2 | | AZALEA LANE | 2 |
| | | Fire incidents reported |
|---|
| Sreet name | Count |
|---|
| AZALEA RD | 2 | | BEAGLE RD | 2 | | BEAGLE ROAD | 2 | | BENDIGO ST | 2 | | CHESTNUT (13) ST | 2 | | CLARKS VALLEY ROAD | 2 | | COLLIERY | 2 | | COLLIERY (66) AVE | 2 | | COLLIERY RD | 2 | | DIETRICH (22) AVE | 2 | | DIETRICH AVE | 2 | | DIETRICH AVE | 2 | | E GRAND AVE | 2 | | EAST WICONISCO AVE | 2 | | EAST WICONISCO STREET | 2 | | GOLDMINE RD | 2 | | GOLDMINE ROAD | 2 | | GRAND (22) AVE | 2 | | GREENWOOD (22) RD | 2 | | GREENWOOD RD | 2 | | MAPLE (66) AVE | 2 | | MARKET ST | 2 | | MIDWAY RD | 2 | | MIDWAY ROAD | 2 | | |
|
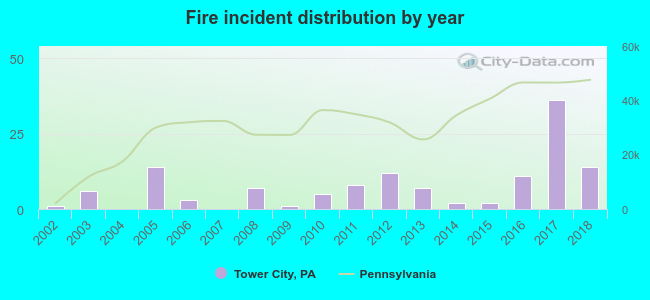 According to the data from the years 2002 - 2018 the average number of fire incidents per year is 8. The highest number of reported fire incidents - 36 took place in 2017, and the least - 0 in 2004. The data has an increasing trend.
 36.4% incidents where reported in the morning and 63.6% in the evening. The most fires (24.8%) took place on Friday, and the least (8.5%) on Tuesday.
 According to the 129 fire incident reports from years 2002 - 2018 most fires (16.3%) took place during March, and the least (1.6%) in August.
 Out of all 470 cases reported during the years 2002 - 2018, the most belonged to the categories: Overpressure Rupture (28.9%), Fire (27.4%), and Hazardous Condition (11.9%).
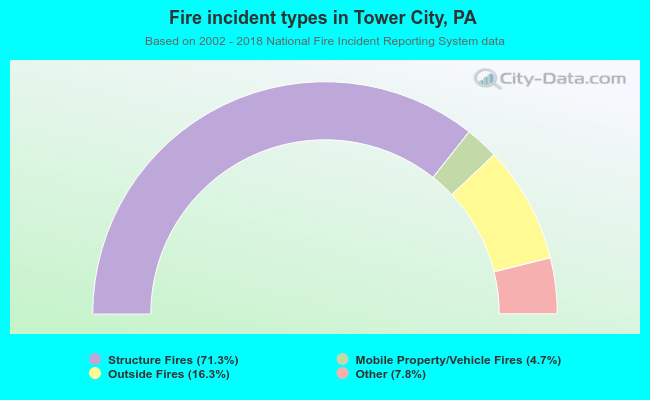 When looking into fire subcategories, the most reports belonged to: Structure Fires (71.3%), and Outside Fires (16.3%).