Toulon: Fire Incidents, Illinois (IL)
Where are fire incidents reported in Toulon, IL
Something went wrong! Please refresh the page.
|
| |||||||||||||||||||||||||||||||||||||||||||||||||||||||||||||||||||||||||||||||||||||||||||||||||||||||||||||
| Other | 42 | |||||||||||||||||||||||||||||||||||||||||||||||||||||||||||||||||||||||||||||||||||||||||||||||||||||||||||||
2002 - 2018 National Fire Incident Reporting System (NFIRS) incidents
- Incident types reported to NFIRS in Toulon, IL
- 69960.2%Rescue & EMS
- 26022.4%Fire
- 1069.1%Hazardous Condition
- 342.9%Good Intent Call
- 252.2%False Alarm
- 181.5%Service Call
- 171.5%Severe Weather
- 20.2%Special Incident
- Fire incident types reported to NFIRS in Toulon, IL
- 13853.1%Outside Fires
- 7328.1%Structure Fires
- 3915.0%Mobile Property/Vehicle Fires
- 103.8%Other
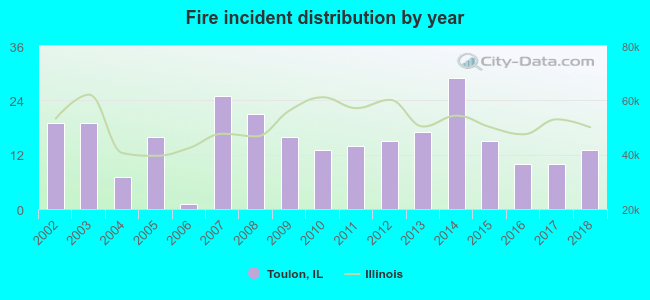 Based on the data from the years 2002 - 2018 the average number of fires per year is 15. The highest number of fire incidents - 29 took place in 2014, and the least - 1 in 2006. The data has a decreasing trend.
 28.1% incidents where reported in the morning and 71.9% in the evening. The most fires (16.9%) took place on Friday, and the least (10.0%) on Monday.
 Based on the 260 incident reports from years 2002 - 2018 most fires (16.9%) took place during April, and the least (3.5%) in February.
 Out of all 1,162 cases reported during the years 2002 - 2018, the most belonged to the categories: Rescue & EMS (60.2%), Fire (22.4%), and Hazardous Condition (9.1%).
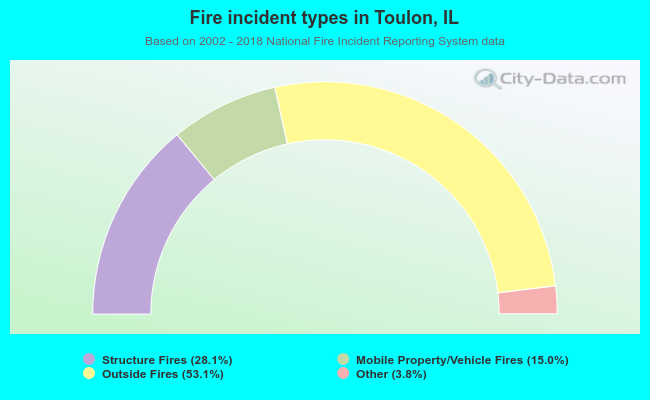 When looking into fire subcategories, the most reports belonged to: Outside Fires (53.1%), and Structure Fires (28.1%).