Tonica: Fire Incidents, Illinois (IL)
Where are fire incidents reported in Tonica, IL
Something went wrong! Please refresh the page.
|
| |||||||||||||||||||||||||||||||||||||||||||||||||||||||||||||||||||||||||||||||||||||||||||||||||||||||||||||
| Other | 11 | |||||||||||||||||||||||||||||||||||||||||||||||||||||||||||||||||||||||||||||||||||||||||||||||||||||||||||||
2002 - 2018 National Fire Incident Reporting System (NFIRS) incidents
- Incident types reported to NFIRS in Tonica, IL
- 37354.2%Rescue & EMS
- 17725.7%Fire
- 558.0%Hazardous Condition
- 324.7%Good Intent Call
- 263.8%Service Call
- 172.5%False Alarm
- 81.2%Severe Weather
- Fire incident types reported to NFIRS in Tonica, IL
- 8648.6%Structure Fires
- 5832.8%Outside Fires
- 2313.0%Mobile Property/Vehicle Fires
- 105.6%Other
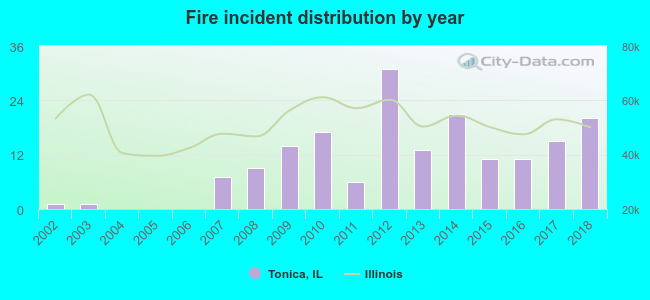 Based on the data from the years 2002 - 2018 the average number of fire incidents per year is 10. The highest number of reported fire incidents - 31 took place in 2012, and the least - 0 in 2004. The data has an increasing trend.
 30.5% incidents where reported in the morning and 69.5% in the evening. The most fires (23.2%) took place on Tuesday, and the least (8.5%) on Wednesday.
 Based on the 177 reports from years 2002 - 2018 most fires (15.3%) took place during April, and the least (2.8%) in February.
 Out of all 688 cases reported during the years 2002 - 2018, the most belonged to the categories: Overpressure Rupture (54.2%), Fire (25.7%), and Rescue & EMS (8.0%).
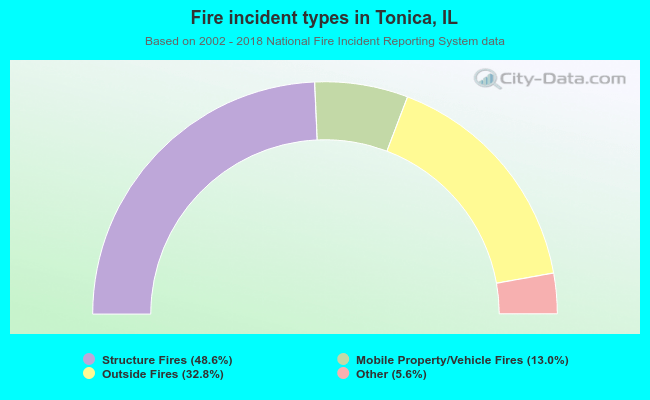 When looking into fire subcategories, the most incidents belonged to: Structure Fires (48.6%), and Outside Fires (32.8%).