| Fire incidents reported |
|---|
| Sreet name | Count |
|---|
| WASHINGTON ST | 14 | | W9701 CTH M | 10 | | CENTER RD | 8 | | FISHER AVE | 8 | | N10620 CENTER RD | 8 | | COUNTY LINE RD | 6 | | GORMAN AVE | 6 | | MAIN ST | 6 | | N14639 FISHER AVE | 6 | | 208 W FRANKLIN ST | 4 | | CLOVERDALE RD | 4 | | COLBY FACTORY RD | 4 | | GORMAN AVE | 4 | | N13850 TIEMAN AVE | 4 | | N14910 GORMAN AVE | 4 | | N16890 KOSER AVE | 4 | | W9199 COUNTY LINE RD | 4 | | WASHINGTON ST | 4 | | POPPLE RIVERTIEMAN | 2 | | 100 W STANLEY ST | 2 | | 101 NORTH BROADMAN STREET | 2 | | 102 E LAWRENCE ST | 2 | | 102 N CHURCH ST ST | 2 | | 104 E MAIN ST | 2 | | 104 N CLARK ST | 2 |
| | | Fire incidents reported |
|---|
| Sreet name | Count |
|---|
| 105 N BOARDMAN ST | 2 | | 105 W GRANT ST ST | 2 | | 107 W MAIN ST ST | 2 | | 200 E KRYCH ST ST | 2 | | 200 E KRYCH STS | 2 | | 201 N WASHINGTON ST | 2 | | 203 E BINCH ST | 2 | | 203 W HILL ST ST | 2 | | 205 N WASHINGTON ST | 2 | | 205 W HILL ST | 2 | | 206 W BIRCH ST | 2 | | 206 W PROSPECT ST | 2 | | 206 WEST PROSPECT | 2 | | 213 N WASHINTON ST | 2 | | 215217 N WASHINGTON ST | 2 | | 300 BLOCK OF EAST STANLEY ST ST | 2 | | 300 W STANLEY ST | 2 | | 300 WEST PROSPECT | 2 | | 305 E SCHOOL ST | 2 | | 305 S CLARK ST | 2 | | 313 N WASHINGTON ST | 2 | | 405 E STANLEY ST | 2 | | 407 E STANLEY ST | 2 | | 409 E MAIN ST | 2 | | |
|
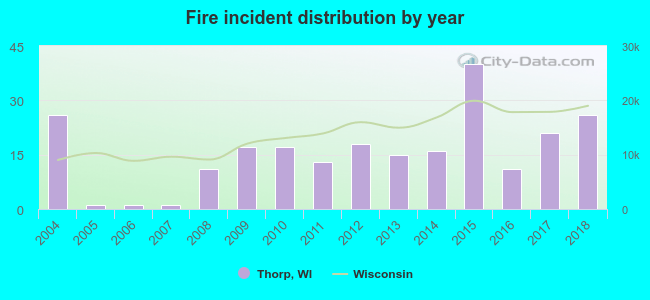 Based on the data from the years 2004 - 2018 the average number of fires per year is 16. The highest number of reported fires - 40 took place in 2015, and the least - 1 in 2005. The data has a constant trend.
 38.5% incidents where reported in the morning and 61.5% in the evening. The most fires (20.5%) took place on Wednesday, and the least (9.4%) on Sunday.
 According to the 234 fires from years 2004 - 2018 most fires (14.1%) took place during May, and the least (2.6%) in October.
 Out of all 392 cases reported during the years 2004 - 2018, the most belonged to the categories: Fire (59.7%), Overpressure Rupture (17.1%), and Rescue & EMS (11.5%).
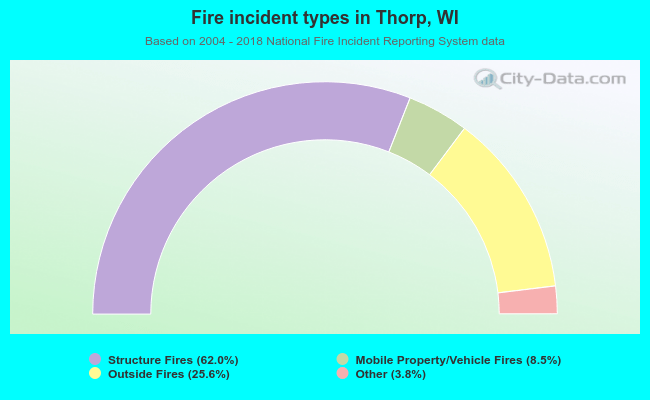 When looking into fire subcategories, the most incidents belonged to: Structure Fires (62.0%), and Outside Fires (25.6%).