| Fire incidents reported |
|---|
| Sreet name | Count |
|---|
| BROADWAY | 72 | | KENSICO RD | 24 | | COLUMBUS AVE | 22 | | OLD KENSICO RD | 22 | | SUNSET DR | 22 | | MANHATTAN AVE | 18 | | ROLLING HILLS RD | 18 | | SAW MILL RIVER PARKWAY | 18 | | WARREN AVE | 18 | | COLUMBUS AVE | 16 | | LINDA AVE | 16 | | NANNYHAGEN RD | 16 | | SHERMAN AVE | 16 | | COMMERCE ST | 14 | | MARBLE AVE | 14 | | COMMERCE STREET | 12 | | FRANKLIN AVE | 12 | | HILLTOP LN | 10 | | NANNYHAGEN RD | 10 | | WESTLAKE DR | 10 | | COMMERCE ST | 8 | | EUNICE LN | 8 | | NANNYHAGEN ROAD | 8 | | PALMER LN | 8 | | SWANSON DR | 8 |
| | | Fire incidents reported |
|---|
| Sreet name | Count |
|---|
| VIRGINIA LN | 8 | | COLUMBUS AVE. | 6 | | LINDA AVE | 6 | | WESTCHESTER AVE | 6 | | WESTERLY LN | 6 | | WHITTIER DR | 6 | | ALLISON LN | 4 | | ASPEN WAY | 4 | | BAINBRIDGE AVE | 4 | | CANDLEWOOD COURT | 4 | | CLAREMONT AVE | 4 | | COLUMBUS AVENUE | 4 | | EASTVIEW DR | 4 | | ETON RD | 4 | | FOXWOOD LN | 4 | | FRANKLIN AVENUE | 4 | | GLEN FOREST RD | 4 | | HIGHLAND RD | 4 | | ILANA LN | 4 | | KENSICO RD | 4 | | KENSICO ROAD | 4 | | KENSINGTON AVE | 4 | | MANHATTAN AVENUE | 4 | | MILTON DR | 4 | | OLD KENSICO RD | 4 |
|
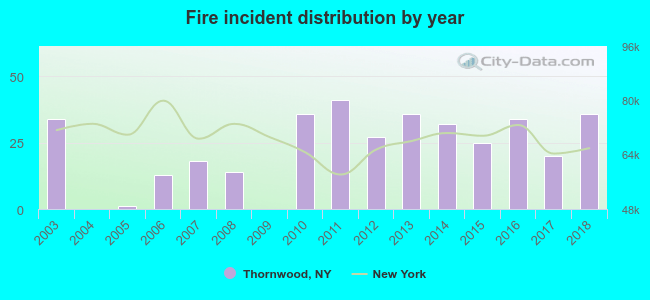 According to the data from the years 2003 - 2018 the average number of fires per year is 23. The highest number of reported fire incidents - 41 took place in 2011, and the least - 0 in 2004. The data has an increasing trend.
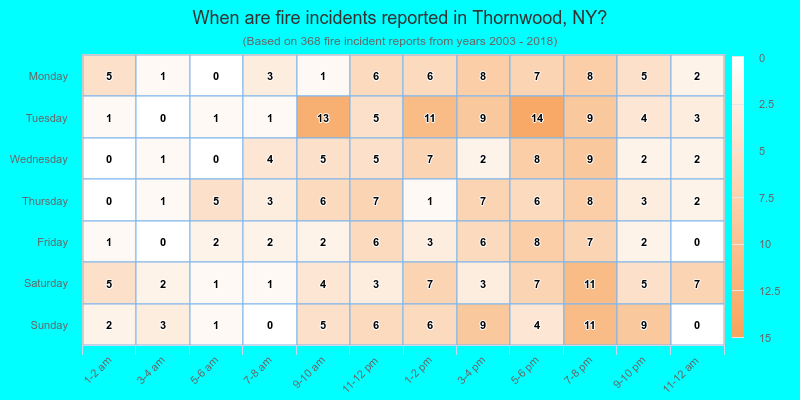
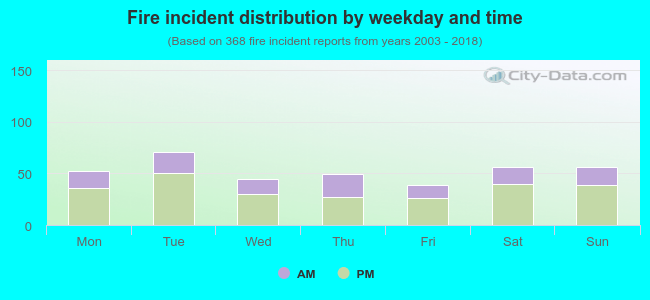 32.6% incidents where reported in the morning and 67.4% in the evening. The most fires (19.3%) took place on Tuesday, and the least (10.6%) on Friday.
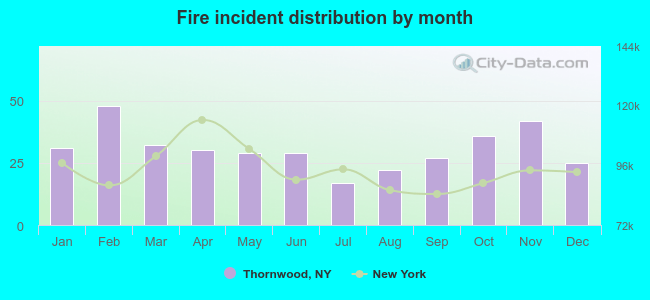 According to the 368 reports from years 2003 - 2018 most fires (13.0%) took place during February, and the least (4.6%) in July.
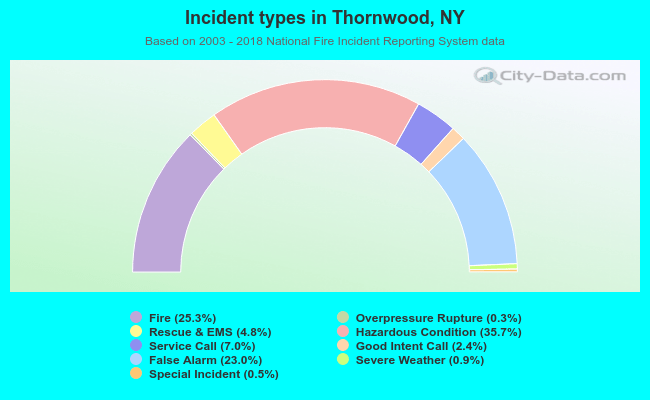 Out of all 1,455 cases reported during the years 2003 - 2018, the most belonged to the categories: Hazardous Condition (35.7%), Fire (25.3%), and False Alarm (23.0%).
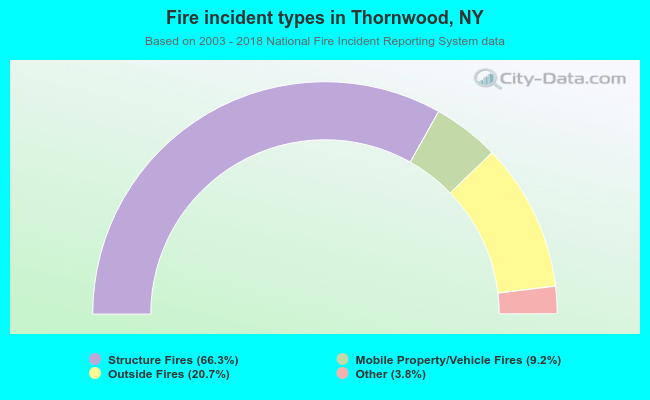 When looking into fire subcategories, the most reports belonged to: Structure Fires (66.3%), and Outside Fires (20.7%).