| Fire incidents reported |
|---|
| Sreet name | Count |
|---|
| LINCOLN HW | 74 | | BAILEY RD | 28 | | MEADOWLAKE DR | 24 | | LINCOLN HW | 22 | | LINCOLN | 20 | | BARLEY SHEAF RD | 12 | | KINGS HW | 12 | | 30 BYPASS BYP | 10 | | LINCOLN HWY | 10 | | 30 BYPASS WO 340 | 6 | | BLUFF RD | 6 | | BONDSVILLE RD | 6 | | CREST DR | 6 | | FIRST MONTGOMERY BL | 6 | | FOOTHILL TC | 6 | | GREENBRIAR RD | 6 | | HONEYMEAD RD | 6 | | HORSESHOE DR | 6 | | JAMES BUCHANAN DR | 6 | | RT 30 BYP | 6 | | THORNRIDGE DR | 6 | | WALNUT ST | 6 | | WESTBURY CT | 6 | | ALYDAR RD | 4 | | APPLEDORE DR | 4 |
| | | Fire incidents reported |
|---|
| Sreet name | Count |
|---|
| ASHLEY CT | 4 | | CALN RD | 4 | | EDGES MILL RD | 4 | | FIRST MONTGOMERY | 4 | | FISHERVILLE RD | 4 | | FOOT HILL TERR | 4 | | GOLFERS WY | 4 | | HAZELWOOD AV | 4 | | HUMPTON RD | 4 | | JASON LA | 4 | | LINCOLN HWY | 4 | | LOOMIS AV | 4 | | MARSHALL CI | 4 | | MARSHALLTON THORNDALE RD | 4 | | MILL CREEK CT | 4 | | OVERLEAF DR | 4 | | PAUL NELMS DR | 4 | | SHELBURNE RD | 4 | | SKYVIEW LA | 4 | | TURTLEPOINT LA | 4 | | WINDSOR LA | 4 | | WOODVIEW DR | 4 | | 1ST MONTGOMERY BLVD | 2 | | 30 BP AT HORSESHOE RT | 2 | | |
|
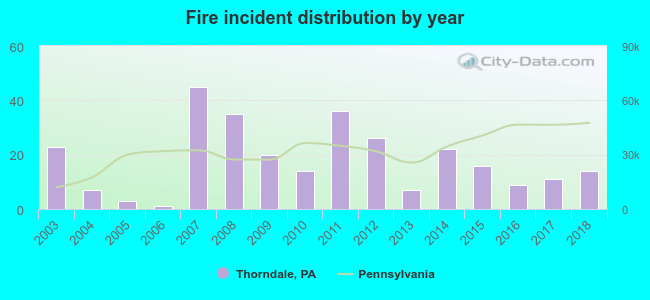 According to the data from the years 2003 - 2018 the average number of fire incidents per year is 18. The highest number of reported fires - 45 took place in 2007, and the least - 1 in 2006. The data has a declining trend.
 29.1% incidents where reported in the morning and 70.9% in the evening. The most fires (18.0%) took place on Monday, and the least (9.3%) on Wednesday.
 According to the 289 fire incidents from years 2003 - 2018 most fires (15.9%) took place during May, and the least (2.8%) in November.
 Out of all 1,232 cases reported during the years 2003 - 2018, the most belonged to the categories: Fire (23.5%), False Alarm (21.9%), and Hazardous Condition (18.6%).
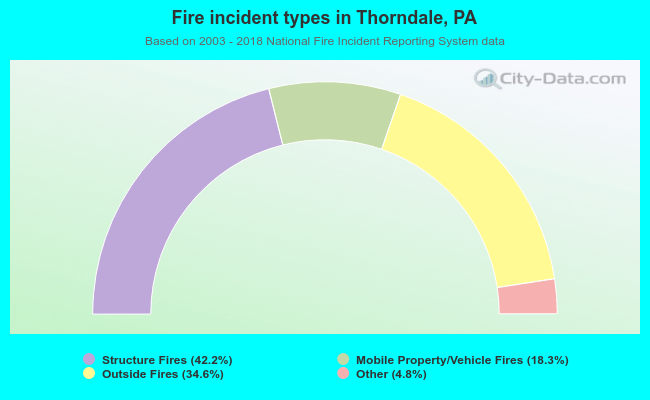 When looking into fire subcategories, the most reports belonged to: Structure Fires (42.2%), and Outside Fires (34.6%).