Thonotosassa: Fire Incidents, Florida (FL)
Where are fire incidents reported in Thonotosassa, FL
Something went wrong! Please refresh the page.
|
| |||||||||||||||||||||||||||||||||||||||||||||||||||||||||||||||||||||||||||||||||||||||||||||||||||||||||||||
2002 - 2018 National Fire Incident Reporting System (NFIRS) incidents
- Incident types reported to NFIRS in Thonotosassa, FL
- 3,28884.0%Rescue & EMS
- 3228.2%Good Intent Call
- 1453.7%Fire
- 621.6%Service Call
- 541.4%Hazardous Condition
- 270.7%False Alarm
- 150.4%Special Incident
- Fire incident types reported to NFIRS in Thonotosassa, FL
- 6343.4%Structure Fires
- 4933.8%Outside Fires
- 3322.8%Mobile Property/Vehicle Fires
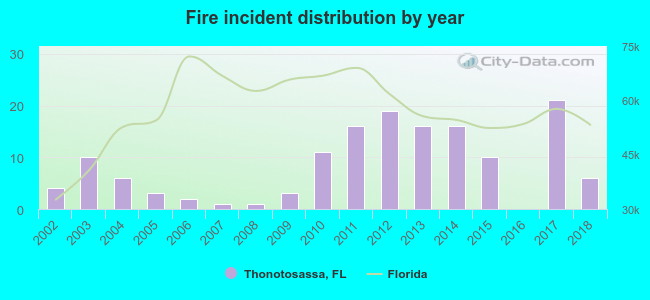 Based on the data from the years 2002 - 2018 the average number of fires per year is 9. The highest number of reported fires - 21 took place in 2017, and the least - 0 in 2016. The data has an increasing trend.
The average number of yearly fire incidents per 10k residents in Thonotosassa, FL compared to nearest cities:
(Note: Based on data for the last 3 years, including only cities with population 5,000 and above)
| Thonotosassa: | 10.4 |
| Seffner: | 10.6 |
| Temple Terrace: | 16.8 |
| Brandon: | 3.5 |
| Valrico: | 7.3 |
| Wesley Chapel: | 20.4 |
| Plant City: | 49.4 |
| Lutz: | 14.8 |
| Tampa: | 38.7 |

 33.1% incidents where reported in the morning and 66.9% in the evening. The most fires (20.0%) took place on Thursday, and the least (9.0%) on Sunday.
 Based on the 145 fires from years 2002 - 2018 most fires (14.5%) took place during May, and the least (2.8%) in October.
 Out of all 3,914 cases reported during the years 2002 - 2018, the most belonged to the categories: Rescue & EMS (84.0%), Good Intent Call (8.2%), and Fire (3.7%).
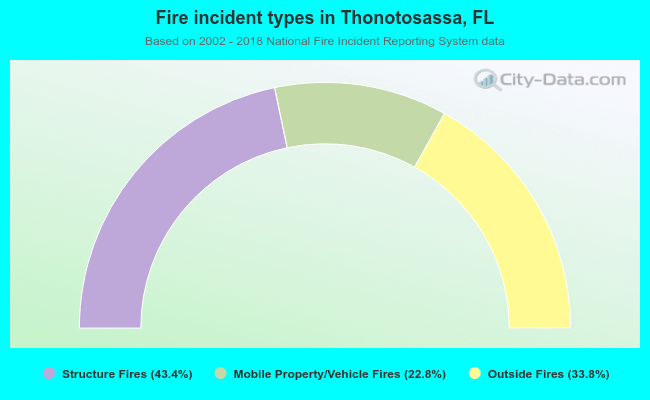 When looking into fire subcategories, the most reports belonged to: Structure Fires (43.4%), and Outside Fires (33.8%).