| Fire incidents reported |
|---|
| Sreet name | Count |
|---|
| THOMPSONVILLE RD | 18 | | CORINTH RD | 16 | | EASTERN RD | 14 | | HOOVER RD | 12 | | PUCKETT RD | 12 | | CORINTH ROAD RD | 10 | | MALONE RD | 10 | | MOORE RD | 10 | | CARLYLE RD | 8 | | FANCY FARM RD | 8 | | KING RD | 8 | | MACEDONIA RD | 8 | | STATE HIGHWAY 34 HWY | 8 | | THORN ROAD RD | 8 | | AKIN BLACKTOP RD | 6 | | AMOS RD | 6 | | BOLEN STORE RD | 6 | | DAVIS RD | 6 | | DEAN RD | 6 | | FORD RD | 6 | | JORDAN FORT RD | 6 | | MACEDONIA RD. | 6 | | N. THOMPSONVILLE RD | 6 | | SHARP LANE | 6 | | SHAWNEETOWN RD | 6 |
| | | Fire incidents reported |
|---|
| Sreet name | Count |
|---|
| SOMERS CHURCH RD | 6 | | SOMERS CHURCH ROAD RD | 6 | | STATE HWY 34 | 6 | | THOMPSONVILLE ROAD RD | 6 | | AKIN BLACKTOP | 4 | | ALLEGHANY RD | 4 | | BOBTAIL RD. | 4 | | BOLEN STORE RD. | 4 | | BYERS RD | 4 | | CAVE RD | 4 | | CRAWFORD RD | 4 | | DIAL RD | 4 | | DWINA RD | 4 | | DWINA ROAD RD | 4 | | HAMILTON COUNTY | 4 | | LIBERTY SCHOOL RD | 4 | | LILES RD | 4 | | MACE RD. | 4 | | MACEDONIA RD | 4 | | MALONE ROAD RD | 4 | | MCREYNOLDS LN | 4 | | MOCABY ROAD | 4 | | N.THOMPSONVILLE RD. | 4 | | NEAL DAVIS RD | 4 | | |
|
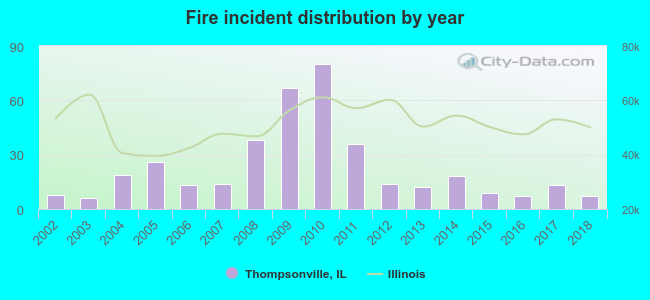 Based on the data from the years 2002 - 2018 the average number of fires per year is 23. The highest number of reported fire incidents - 80 took place in 2010, and the least - 6 in 2003. The data has a decreasing trend.
 30.2% incidents where reported in the morning and 69.8% in the evening. The most fires (18.3%) took place on Thursday, and the least (9.8%) on Monday.
 Based on the 387 fire incident reports from years 2002 - 2018 most fires (15.8%) took place during March, and the least (3.6%) in June.
 Out of all 852 cases reported during the years 2002 - 2018, the most belonged to the categories: Fire (45.4%), Rescue & EMS (44.8%), and Hazardous Condition (3.9%).
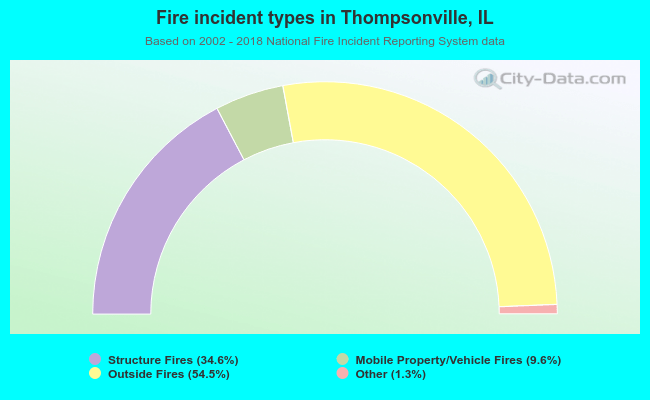 When looking into fire subcategories, the most incidents belonged to: Outside Fires (54.5%), and Structure Fires (34.6%).