| Fire incidents reported |
|---|
| Sreet name | Count |
|---|
| CHURCH ST | 16 | | US 45 | 12 | | 1600E | 8 | | COMMERCIAL ST | 8 | | COUNTY ROAD 2400N | 8 | | I-57 | 8 | | INTERSTATE 57 | 8 | | ROUTE 45 & 2300 N | 8 | | COUNTY ROAD 2400 | 6 | | COUNTY ROAD 2500N | 6 | | COUNTY ROAD 2600 | 6 | | LINCOLN ST | 6 | | PEARL ST | 6 | | RT 45 | 6 | | 1300 | 4 | | 2000 | 4 | | 2268 CO RD 1300 E | 4 | | 2400 N | 4 | | 400 N PHILLIPS | 4 | | 704 W CLARK ST | 4 | | COUNTY ROAD 1600E | 4 | | MARTIN RD | 4 | | ROUTE 45 & 2700 N | 4 | | THOMAS ST | 4 | | 100 S CHURCH ST | 2 |
| | | Fire incidents reported |
|---|
| Sreet name | Count |
|---|
| 100 WEST CLARK | 2 | | 1000 N CHURCH | 2 | | 102 N LINCOLN ST | 2 | | 107 E NORTH ST. | 2 | | 107 W MAIN ST | 2 | | 1078 CO RD 2200 N | 2 | | 1100 E AND 2400 N | 2 | | 1109 CO RD 2400 N | 2 | | 1200 E AND 2500 N RD | 2 | | 1273 CR 2500N | 2 | | 1300 E 2400 N | 2 | | 1300 E 2500 N | 2 | | 1300E AND 2200N | 2 | | 1350 CO RD 2300N | 2 | | 1350 E 2200 N | 2 | | 1350 ON 2200N | 2 | | 1373 CO RD 2400 N | 2 | | 1425 CO RD 2300 N | 2 | | 1450 E & 2400 N | 2 | | 1450 E 2300 N | 2 | | 1473 CO RD 2500 N | 2 | | 1473 COUNTY ROAD 2500 NORTH | 2 | | 1476 1900N | 2 | | 1486 2400N | 2 | | |
|
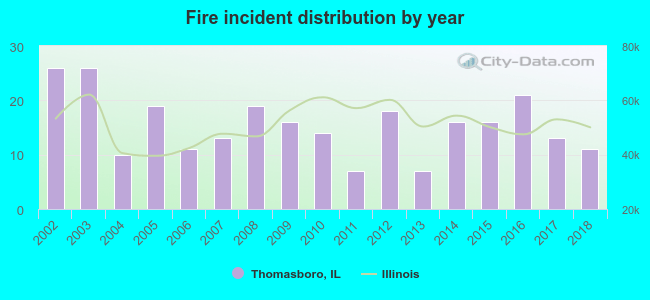 Based on the data from the years 2002 - 2018 the average number of fires per year is 15. The highest number of reported fire incidents - 26 took place in 2002, and the least - 7 in 2011. The data has a decreasing trend.
 29.3% incidents where reported in the morning and 70.7% in the evening. The most fires (16.0%) took place on Tuesday, and the least (9.9%) on Sunday.
 Based on the 263 fire incident reports from years 2002 - 2018 most fires (18.3%) took place during March, and the least (3.4%) in December.
 Out of all 1,206 cases reported during the years 2002 - 2018, the most belonged to the categories: Good Intent Call (39.8%), Fire (21.8%), and Rescue & EMS (20.7%).
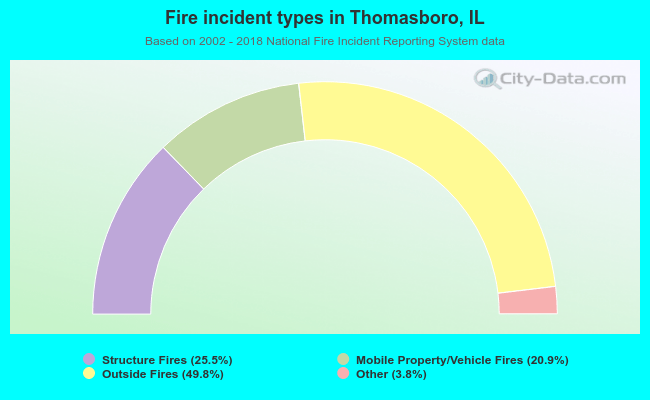 When looking into fire subcategories, the most incidents belonged to: Outside Fires (49.8%), and Structure Fires (25.5%).