Theodore: Fire Incidents, Alabama (AL)
Where are fire incidents reported in Theodore, AL
Something went wrong! Please refresh the page.
|
| |||||||||||||||||||||||||||||||||||||||||||||||||||||||||||||||||||||||||||||||||||||||||||||||||||||||||||||
2006 - 2018 National Fire Incident Reporting System (NFIRS) incidents
- Incident types reported to NFIRS in Theodore, AL
- 2,20071.9%Rescue & EMS
- 59019.3%Fire
- 1334.3%False Alarm
- 782.5%Hazardous Condition
- 321.0%Good Intent Call
- 130.4%Service Call
- 70.2%Overpressure Rupture
- 40.1%Severe Weather
- Fire incident types reported to NFIRS in Theodore, AL
- 36061.0%Outside Fires
- 15826.8%Structure Fires
- 559.3%Mobile Property/Vehicle Fires
- 172.9%Other
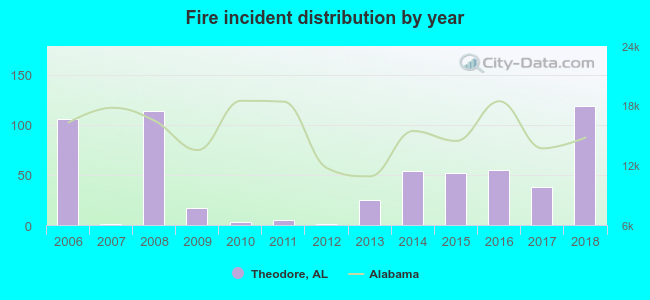 According to the data from the years 2006 - 2018 the average number of fires per year is 45. The highest number of reported fires - 119 took place in 2018, and the least - 1 in 2007. The data has an increasing trend.
The average number of yearly fire incidents per 10k residents in Theodore, AL compared to nearest cities:
(Note: Based on data for the last 3 years, including only cities with population 5,000 and above)
| Theodore: | 115.3 |
| Mobile: | 15.4 |
| Prichard: | 37.1 |
| Chickasaw: | 1.7 |
| Fairhope: | 26.4 |
| Spanish Fort: | 34.2 |
| Semmes: | 45.4 |
| Daphne: | 35.3 |
| Saraland: | 41.2 |
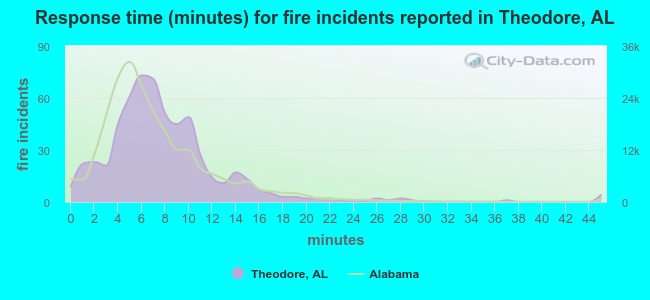 The median response time based on all reported fire incidents is 7 minutes. This is about the same as the state median value.
The median response time in Theodore, AL compared to nearest cities:
(Note: Based on data for all years, including only cities with at least 500 fire incidents)
| Theodore: | 7 minutes |
| Mobile: | 7 minutes |
| Prichard: | 5 minutes |
| Fairhope: | 8 minutes |
| Semmes: | 8 minutes |
| Daphne: | 6 minutes |
| Saraland: | 5 minutes |
| Satsuma: | 4 minutes |
| Foley: | 7 minutes |
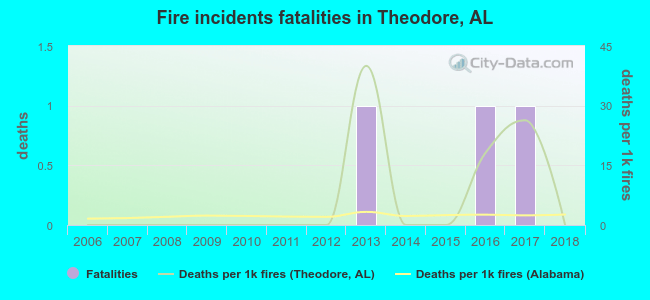 Based on the reports from the years 2006 - 2018 the average number of fire-related yearly deaths is 0. The highest number of reported deaths - 1 took place in 2013, and the lowest - 0 in 2006. The data has a constant trend.
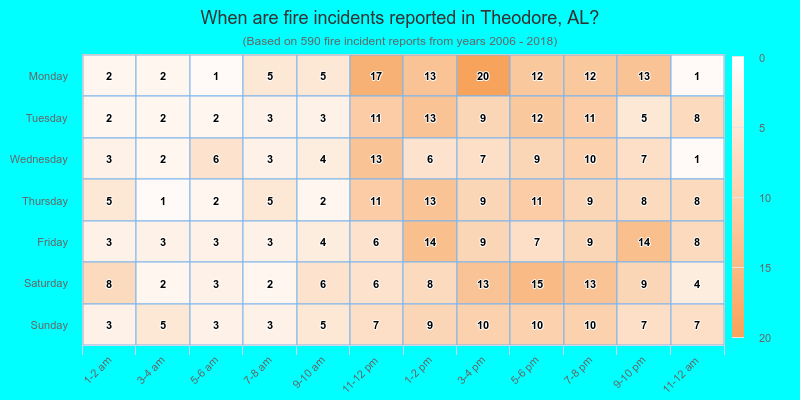
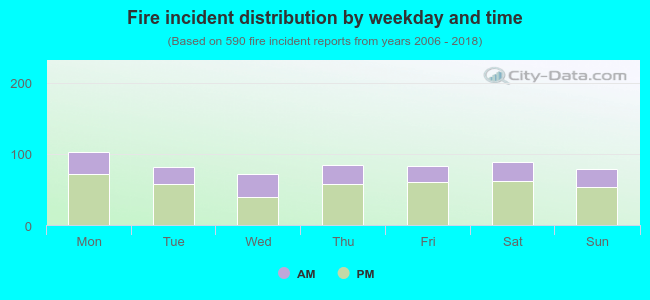 31.7% incidents where reported in the morning and 68.3% in the evening. The most fires (17.5%) took place on Monday, and the least (12.0%) on Wednesday.
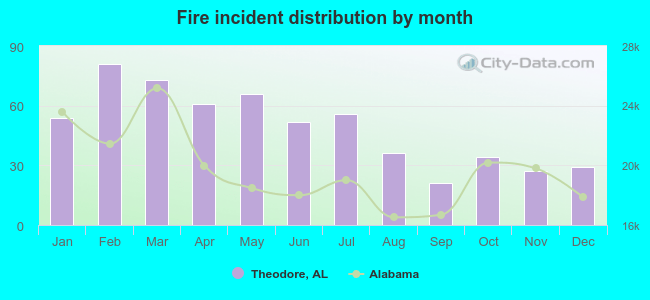 Based on the 590 fires from years 2006 - 2018 most fires (13.7%) took place during February, and the least (3.6%) in September.
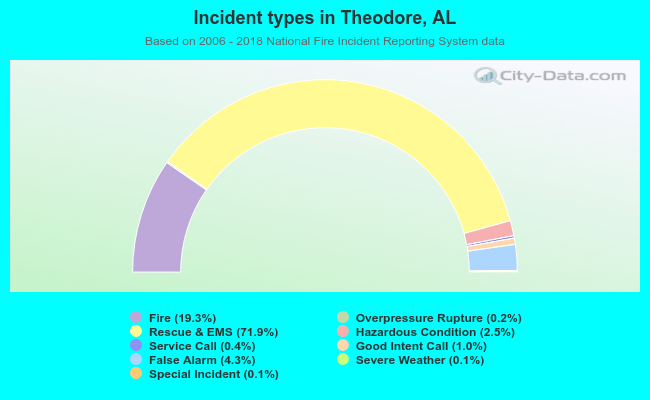 Out of all 3,060 cases reported during the years 2006 - 2018, the most belonged to the categories: Rescue & EMS (71.9%), Fire (19.3%), and False Alarm (4.3%).
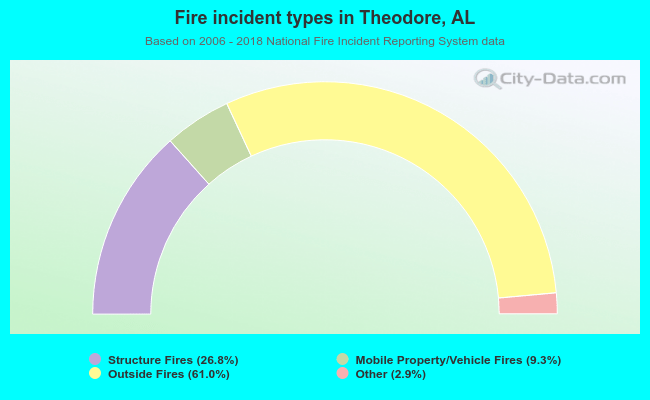 When looking into fire subcategories, the most reports belonged to: Outside Fires (61.0%), and Structure Fires (26.8%).