Tequesta: Fire Incidents, Florida (FL)
Where are fire incidents reported in Tequesta, FL
Something went wrong! Please refresh the page.
|
| |||||||||||||||||||||||||||||||||||||||||||||||||||||||||||||||||||||||||||||||||||||||||||||||||||||||||||||
2002 - 2018 National Fire Incident Reporting System (NFIRS) incidents
- Incident types reported to NFIRS in Tequesta, FL
- 5,78870.5%Rescue & EMS
- 5977.3%Hazardous Condition
- 5937.2%False Alarm
- 4755.8%Good Intent Call
- 4165.1%Service Call
- 3203.9%Fire
- 100.1%Special Incident
- Fire incident types reported to NFIRS in Tequesta, FL
- 13642.5%Outside Fires
- 12940.3%Structure Fires
- 4213.1%Mobile Property/Vehicle Fires
- 134.1%Other
 Based on the data from the years 2002 - 2018 the average number of fires per year is 19. The highest number of reported fires - 29 took place in 2015, and the least - 7 in 2018. The data has a decreasing trend.
The average number of yearly fire incidents per 10k residents in Tequesta, FL compared to nearest cities:
(Note: Based on data for the last 3 years, including only cities with population 5,000 and above)
| Tequesta: | 21.0 |
| Jupiter: | 3.0 |
| Hobe Sound: | 18.7 |
| Palm Beach Gardens: | 2.0 |
| North Palm Beach: | 17.1 |
| Lake Park: | 47.7 |
| Riviera Beach: | 39.6 |
| Port Salerno: | 1.0 |
| Palm Beach: | 41.6 |

 Based on the data from the years 2002 - 2018 the average number of fire-related yearly casualties is 1. The highest number of reported casualties - 6 took place in 2018, and the lowest - 0 in 2002. The data has a growing trend.
 29.4% incidents where reported in the morning and 70.6% in the evening. The most fires (17.5%) took place on Monday, and the least (10.0%) on Friday.
 Based on the 320 fire incidents from years 2002 - 2018 most fires (10.9%) took place during August, and the least (5.9%) in November.
 Out of all 8,211 cases reported during the years 2002 - 2018, the most belonged to the categories: Rescue & EMS (70.5%), Hazardous Condition (7.3%), and False Alarm (7.2%).
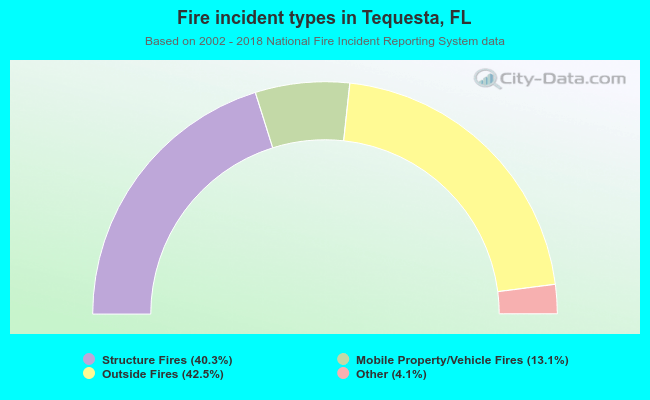 When looking into fire subcategories, the most reports belonged to: Outside Fires (42.5%), and Structure Fires (40.3%).