| Fire incidents reported |
|---|
| Sreet name | Count |
|---|
| KUTZTOWN RD | 34 | | FIFTH STREET HWY | 26 | | 222 (MUHLENBERG) RT | 16 | | ALLENTOWN PIKE | 14 | | MT LAUREL RD | 12 | | GEORGIA RD | 10 | | MOUNT LAUREL AVE | 10 | | POTTSVILLE PIKE | 10 | | SPIES CHURCH ROAD | 10 | | TUCKERTON RD | 10 | | 10TH AVE | 8 | | 61 RT | 8 | | PRICETOWN(24) RD | 8 | | 12TH AVE | 6 | | ANTIETAM(24) RD | 6 | | ELIZABETH AVE | 6 | | FRUSH VALLEY RD | 6 | | MT. LAUREL(24) RD | 6 | | OLD PRICETOWN RD | 6 | | PRICETOWN RD | 6 | | PRICETOWN ROAD | 6 | | SKYLINE DRIVE | 6 | | BEACON HILL RD | 4 | | EL HATCO DR | 4 | | ELM RD | 4 |
| | | Fire incidents reported |
|---|
| Sreet name | Count |
|---|
| EUCLID AVE | 4 | | GREENWOOD DRIVE | 4 | | HILLCREST AVE | 4 | | JEFFERSON ST | 4 | | LAS VEGAS DR | 4 | | LEESPORT (ONTELAUNEE) AVE | 4 | | MAGNOLIA LN | 4 | | MILLER LN | 4 | | RAMICH RD | 4 | | RIVER RD | 4 | | SEFRANKA RD | 4 | | SHALTER AVE | 4 | | STOUDTS FERRY BRIDGE RD | 4 | | TEMPLE BLVD | 4 | | WHITNEY AVE | 4 | | 12 AV | 2 | | 13TH ST | 2 | | 5TH ST HWY | 2 | | 6TH AVE | 2 | | 7TH AVE | 2 | | 8TH AVE | 2 | | ADAMS ST | 2 | | ALLENTOWN PKE | 2 | | ANTIETAM RD | 2 | | |
|
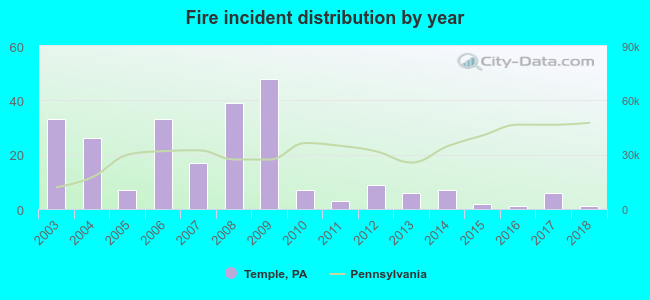 According to the data from the years 2003 - 2018 the average number of fire incidents per year is 15. The highest number of reported fires - 48 took place in 2009, and the least - 1 in 2016. The data has a declining trend.
 33.9% incidents where reported in the morning and 66.1% in the evening. The most fires (16.7%) took place on Thursday, and the least (11.0%) on Monday.
 According to the 245 fire incidents from years 2003 - 2018 most fires (16.7%) took place during March, and the least (2.9%) in August.
 Out of all 561 cases reported during the years 2003 - 2018, the most belonged to the categories: Fire (43.7%), Hazardous Condition (23.7%), and False Alarm (11.8%).
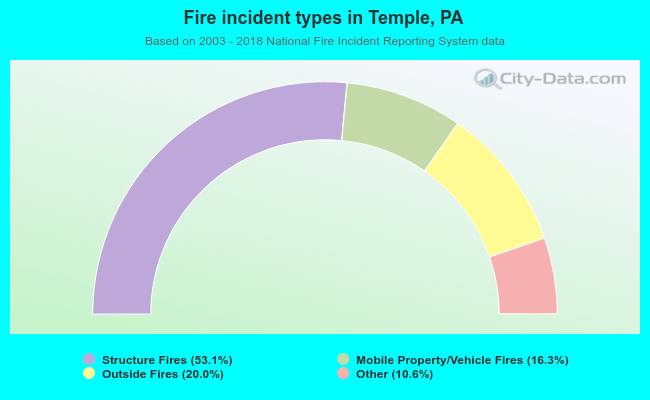 When looking into fire subcategories, the most reports belonged to: Structure Fires (53.1%), and Outside Fires (20.0%).