Tekonsha: Fire Incidents, Michigan (MI)
Where are fire incidents reported in Tekonsha, MI
Something went wrong! Please refresh the page.
|
| |||||||||||||||||||||||||||||||||||||||||||||||||||||||||||||||||||||||||||||||||||||||||||||||||||||||||||||
2002 - 2018 National Fire Incident Reporting System (NFIRS) incidents
- Incident types reported to NFIRS in Tekonsha, MI
- 51036.1%Rescue & EMS
- 33423.6%Fire
- 31822.5%Hazardous Condition
- 14910.5%Service Call
- 564.0%Good Intent Call
- 382.7%False Alarm
- 80.6%Severe Weather
- Fire incident types reported to NFIRS in Tekonsha, MI
- 15446.1%Structure Fires
- 9729.0%Outside Fires
- 6820.4%Mobile Property/Vehicle Fires
- 154.5%Other
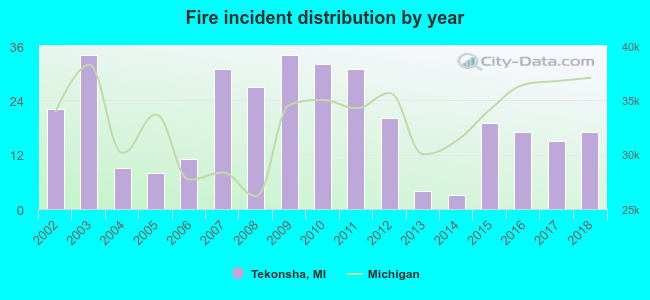 Based on the data from the years 2002 - 2018 the average number of fires per year is 20. The highest number of fire incidents - 34 took place in 2003, and the least - 3 in 2014. The data has a decreasing trend.
 28.4% incidents where reported in the morning and 71.6% in the evening. The most fires (17.1%) took place on Saturday, and the least (10.5%) on Wednesday.
 Based on the 334 fire incident reports from years 2002 - 2018 most fires (13.8%) took place during March, and the least (5.1%) in October.
 Out of all 1,414 cases reported during the years 2002 - 2018, the most belonged to the categories: Overpressure Rupture (36.1%), Fire (23.6%), and Rescue & EMS (22.5%).
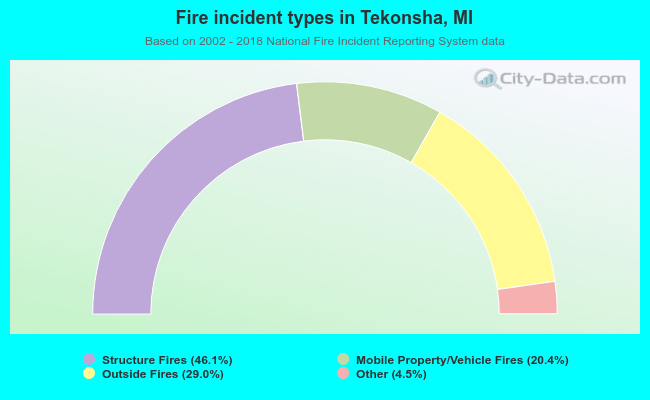 When looking into fire subcategories, the most incidents belonged to: Structure Fires (46.1%), and Outside Fires (29.0%).