Tarentum: Fire Incidents, Pennsylvania (PA)
Where are fire incidents reported in Tarentum, PA
Something went wrong! Please refresh the page.
|
| |||||||||||||||||||||||||||||||||||||||||||||||||||||||||||||||||||||||||||||||||||||||||||||||||||||||||||||
2004 - 2018 National Fire Incident Reporting System (NFIRS) incidents
- Incident types reported to NFIRS in Tarentum, PA
- 47227.4%Fire
- 45726.5%Hazardous Condition
- 26515.4%Rescue & EMS
- 23513.6%Good Intent Call
- 18911.0%False Alarm
- 985.7%Service Call
- 50.3%Special Incident
- 20.1%Severe Weather
- Fire incident types reported to NFIRS in Tarentum, PA
- 27357.8%Structure Fires
- 12025.4%Outside Fires
- 6213.1%Mobile Property/Vehicle Fires
- 173.6%Other
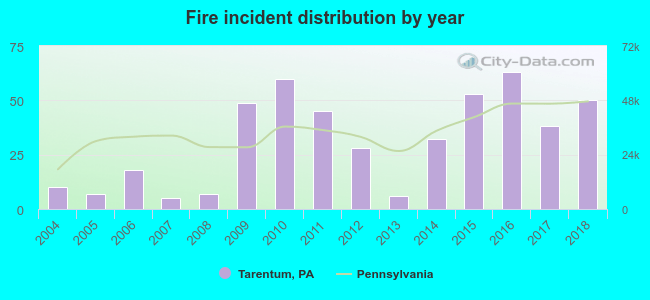 According to the data from the years 2004 - 2018 the average number of fire incidents per year is 31. The highest number of reported fires - 63 took place in 2016, and the least - 5 in 2007. The data has a rising trend.
 32.2% incidents where reported in the morning and 67.8% in the evening. The most fires (16.1%) took place on Saturday, and the least (10.8%) on Thursday.
 According to the 472 fire incidents from years 2004 - 2018 most fires (11.7%) took place during April, and the least (4.0%) in November.
 Out of all 1,724 cases reported during the years 2004 - 2018, the most belonged to the categories: Fire (27.4%), Hazardous Condition (26.5%), and Rescue & EMS (15.4%).
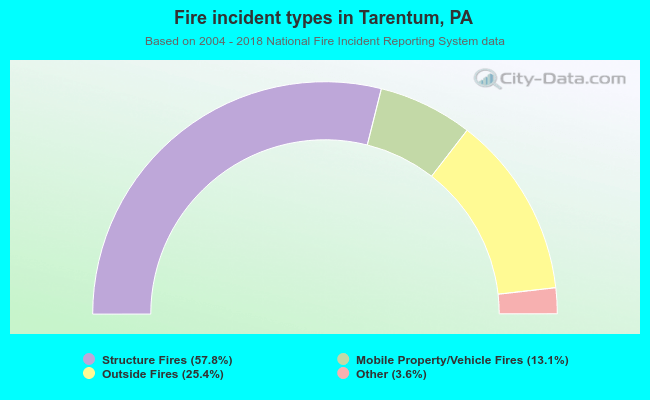 When looking into fire subcategories, the most reports belonged to: Structure Fires (57.8%), and Outside Fires (25.4%).