Talbotton: Fire Incidents, Georgia (GA)
Where are fire incidents reported in Talbotton, GA
Something went wrong! Please refresh the page.
|
| |||||||||||||||||||||||||||||||||||||||||||||||||||||||||||||||||||||||||||||||||||||||||||||||||||||||||||||
| Other | 13 | |||||||||||||||||||||||||||||||||||||||||||||||||||||||||||||||||||||||||||||||||||||||||||||||||||||||||||||
2002 - 2018 National Fire Incident Reporting System (NFIRS) incidents
- Incident types reported to NFIRS in Talbotton, GA
- 32758.7%Fire
- 14025.1%Rescue & EMS
- 315.6%Good Intent Call
- 193.4%Hazardous Condition
- 183.2%Service Call
- 132.3%False Alarm
- 71.3%Severe Weather
- 10.2%Overpressure Rupture
- 10.2%Special Incident
- Fire incident types reported to NFIRS in Talbotton, GA
- 15848.3%Structure Fires
- 8225.1%Outside Fires
- 7422.6%Mobile Property/Vehicle Fires
- 134.0%Other
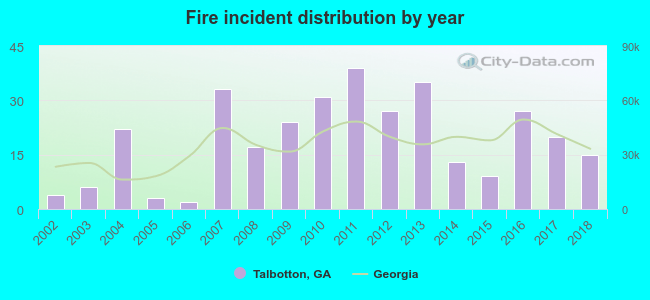 Based on the data from the years 2002 - 2018 the average number of fires per year is 19. The highest number of fires - 39 took place in 2011, and the least - 2 in 2006. The data has an increasing trend.
 37.9% incidents where reported in the morning and 62.1% in the evening. The most fires (20.2%) took place on Sunday, and the least (10.7%) on Friday.
 Based on the 327 fire incidents from years 2002 - 2018 most fires (13.5%) took place during February, and the least (4.3%) in September.
 Out of all 557 cases reported during the years 2002 - 2018, the most belonged to the categories: Fire (58.7%), Rescue & EMS (25.1%), and Good Intent Call (5.6%).
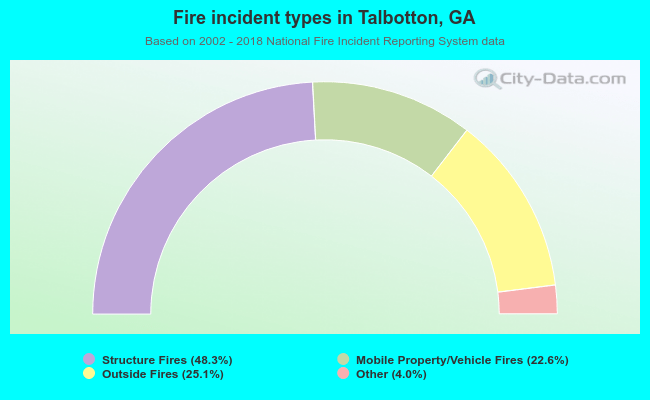 When looking into fire subcategories, the most incidents belonged to: Structure Fires (48.3%), and Outside Fires (25.1%).