Syracuse: Fire Incidents, New York (NY)
Where are fire incidents reported in Syracuse, NY
Something went wrong! Please refresh the page.
| Fire incidents reported | |
|---|---|
| Sreet name | Count |
| SALINA ST | 526 |
| JAMES ST | 522 |
| GENESEE ST | 488 |
| FAYETTE ST | 426 |
| BRIGHTON AVE | 284 |
| LODI ST | 266 |
| ONONDAGA ST | 234 |
| CLINTON ST | 222 |
| OCC DR | 222 |
| PARK ST | 222 |
| BUTTERNUT ST | 188 |
| SALT SPRINGS RD | 184 |
| S OCC DR | 178 |
| COMSTOCK AVE | 174 |
| ERIE BLVD | 172 |
| GIFFORD ST | 168 |
| BURNET AVE | 166 |
| MIDLAND AVE | 160 |
| POND ST | 156 |
| BELLEVUE AVE | 146 |
| SENECA TPKE | 142 |
| STATE ST | 140 |
| COURT ST | 128 |
| CROUSE AVE | 126 |
| SOUTH AVE | 126 |
| CARBON ST | 120 |
| MILTON AVE | 118 |
| OAK ST | 118 |
| ALMOND ST | 108 |
| TOWNSEND ST | 106 |
| Other | 6,568 |
2003 - 2018 National Fire Incident Reporting System (NFIRS) incidents
- Incident types reported to NFIRS in Syracuse, NY
- 44,59141.9%Rescue & EMS
- 16,28515.3%False Alarm
- 12,90412.1%Fire
- 12,39611.7%Hazardous Condition
- 11,22510.6%Good Intent Call
- 8,6388.1%Service Call
- 1460.1%Overpressure Rupture
- 1310.1%Special Incident
- Fire incident types reported to NFIRS in Syracuse, NY
- 7,96561.7%Structure Fires
- 3,51427.2%Outside Fires
- 1,1318.8%Mobile Property/Vehicle Fires
- 2942.3%Other
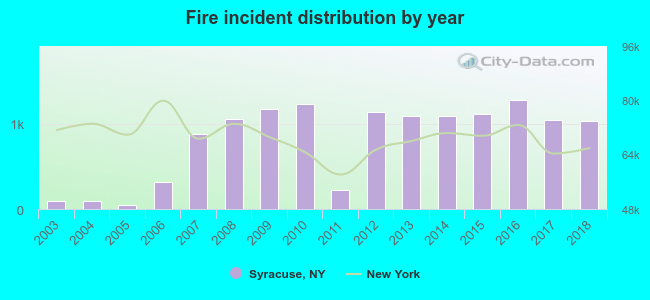 According to the data from the years 2003 - 2018 the average number of fire incidents per year is 805. The highest number of fires - 1,271 took place in 2016, and the least - 41 in 2005. The data has an increasing trend.
The average number of yearly fire incidents per 10k residents in Syracuse, NY compared to nearest cities:
(Note: Based on data for the last 3 years, including only cities with population 5,000 and above)
| Syracuse: | 77.4 |
| De Witt: | 14.3 |
| Mattydale: | 63.1 |
| Solvay: | 38.7 |
| Fairmount: | 1.0 |
| Onondaga: | 3.9 |
| North Syracuse: | 96.9 |
| Clay: | 6.6 |
| Cicero: | 24.4 |
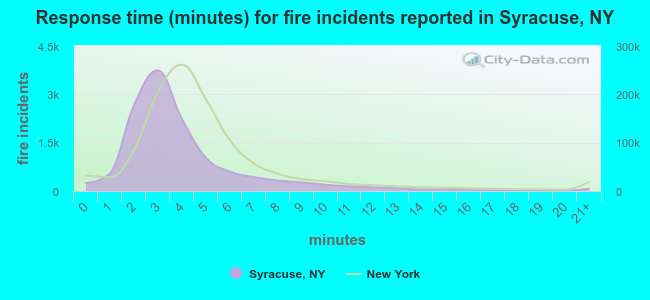 The median response time based on all reported fire incidents is 3 minutes. This is lower compared to the state median value.
The median response time in Syracuse, NY compared to nearest cities:
(Note: Based on data for all years, including only cities with at least 500 fire incidents)
| Syracuse: | 3 minutes |
| Mattydale: | 5 minutes |
| East Syracuse: | 5 minutes |
| Liverpool: | 7 minutes |
| North Syracuse: | 7 minutes |
| Fayetteville: | 5 minutes |
| Clay: | 8 minutes |
| Camillus: | 7 minutes |
| Manlius: | 6 minutes |
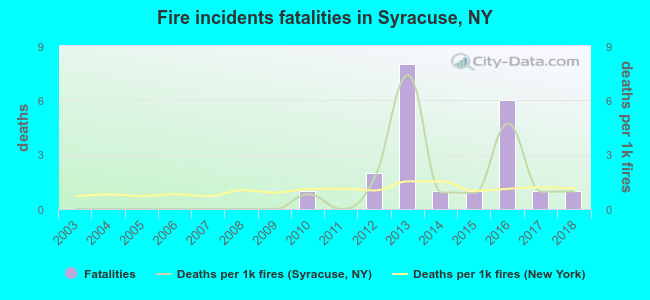 Based on the data from the years 2003 - 2018 the average number of fire-related fatalities per year is 1. The highest number of reported deaths - 8 took place in 2013, and the lowest - 0 in 2003. The data has a rising trend.
The average number of fatalities per 1,000 fires is 1. This indicator was the highest - 7 in 2013, and the lowest 0 in 2003. The trend for fatalities per 1,000 fire incidents is rising. Compared to the state value the number of fatalities per 1,000 fires is higher.
Based on the data from the years 2003 - 2018 the average number of fire-related fatalities per year is 1. The highest number of reported deaths - 8 took place in 2013, and the lowest - 0 in 2003. The data has a rising trend.
The average number of fatalities per 1,000 fires is 1. This indicator was the highest - 7 in 2013, and the lowest 0 in 2003. The trend for fatalities per 1,000 fire incidents is rising. Compared to the state value the number of fatalities per 1,000 fires is higher.Deaths per 1,000 incidents in Syracuse, NY compared to nearest cities:
(Note: Based on data for all years, including only cities with at least 2,500 fire incidents)
| Syracuse: | 1.6 |
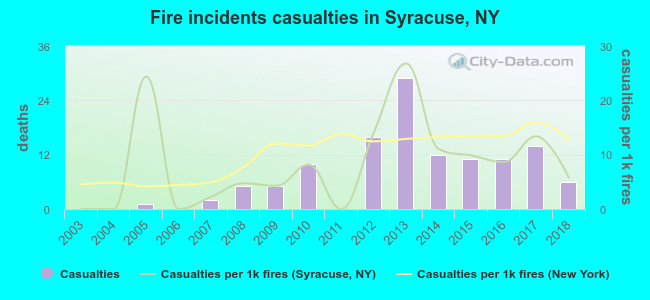 According to the data from the years 2003 - 2018 the average number of fire-related casualties per year is 8. The highest number of casualties - 29 took place in 2013, and the lowest - 0 in 2003. The data has an increasing trend.
The average number of casualties per 1,000 fires is 8. This indicator was the highest - 27 in 2013, and the lowest 0 in 2003. The trend for casualties per 1,000 incidents is rising. Compared to the state value the number of casualties per 1,000 fire incidents is about the same.
According to the data from the years 2003 - 2018 the average number of fire-related casualties per year is 8. The highest number of casualties - 29 took place in 2013, and the lowest - 0 in 2003. The data has an increasing trend.
The average number of casualties per 1,000 fires is 8. This indicator was the highest - 27 in 2013, and the lowest 0 in 2003. The trend for casualties per 1,000 incidents is rising. Compared to the state value the number of casualties per 1,000 fire incidents is about the same.Casualties per 1,000 incidents in Syracuse, NY compared to nearest cities:
(Note: Based on data for all years, including only cities with at least 500 fire incidents)
| Syracuse: | 9.5 |
| Mattydale: | 13.0 |
| East Syracuse: | 0.0 |
| Liverpool: | 13.0 |
| North Syracuse: | 11.5 |
| Fayetteville: | 5.9 |
| Clay: | 17.2 |
| Camillus: | 1.4 |
| Manlius: | 1.0 |
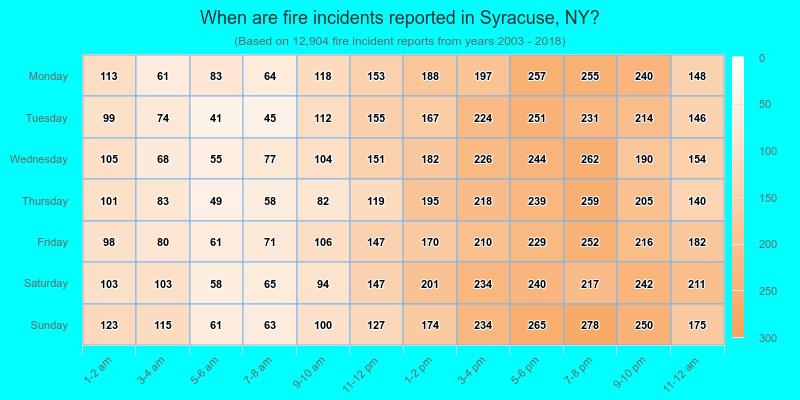
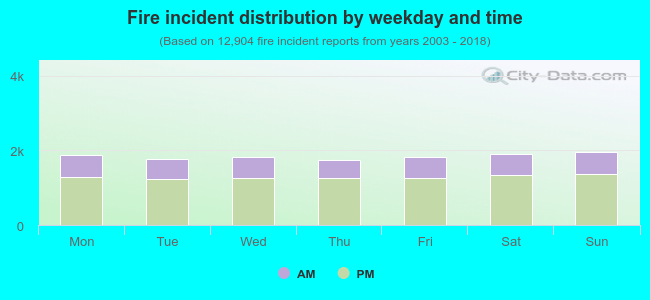 30.2% incidents where reported in the morning and 69.8% in the evening. The most fires (15.2%) took place on Sunday, and the least (13.5%) on Thursday.
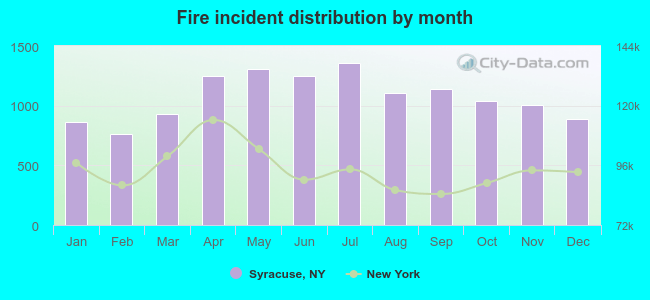 Based on the 12,904 incident reports from years 2003 - 2018 most fires (10.5%) took place during July, and the least (5.9%) in February.
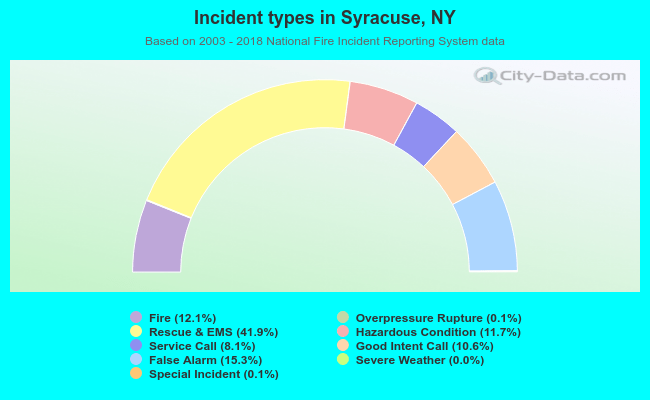 Out of all 106,356 cases reported during the years 2003 - 2018, the most belonged to the categories: Rescue & EMS (41.9%), False Alarm (15.3%), and Fire (12.1%).
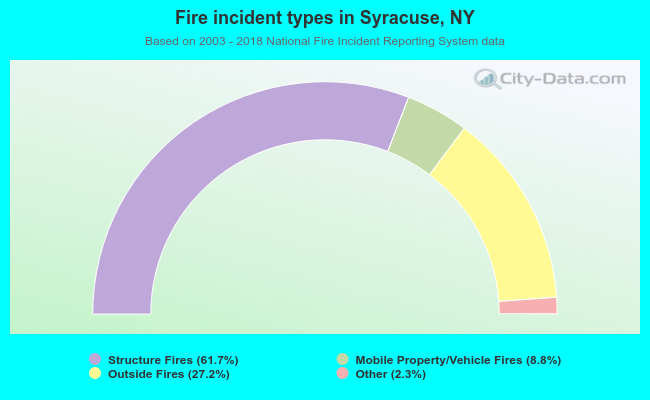 When looking into fire subcategories, the most reports belonged to: Structure Fires (61.7%), and Outside Fires (27.2%).