Switz City: Fire Incidents, Indiana (IN)
Where are fire incidents reported in Switz City, IN
Something went wrong! Please refresh the page.
|
| |||||||||||||||||||||||||||||||||||||||||||||||||||||||||||||||||||||||||||||||||||||||||||||||||||||||||||||
| Other | 32 | |||||||||||||||||||||||||||||||||||||||||||||||||||||||||||||||||||||||||||||||||||||||||||||||||||||||||||||
2002 - 2018 National Fire Incident Reporting System (NFIRS) incidents
- Incident types reported to NFIRS in Switz City, IN
- 22842.1%Rescue & EMS
- 15428.5%Fire
- 6612.2%Hazardous Condition
- 397.2%Special Incident
- 264.8%Service Call
- 132.4%Good Intent Call
- 112.0%False Alarm
- 20.4%Overpressure Rupture
- 20.4%Severe Weather
- Fire incident types reported to NFIRS in Switz City, IN
- 6441.6%Outside Fires
- 5233.8%Structure Fires
- 2818.2%Mobile Property/Vehicle Fires
- 106.5%Other
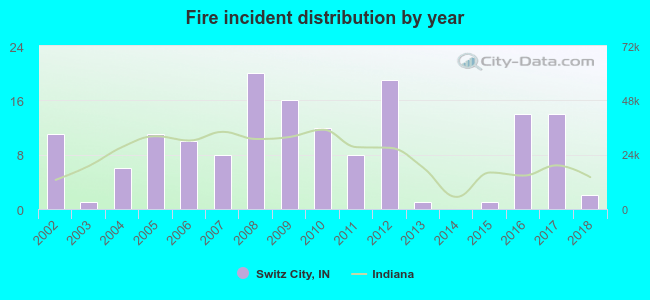 According to the data from the years 2002 - 2018 the average number of fires per year is 9. The highest number of fires - 20 took place in 2008, and the least - 0 in 2014. The data has a dropping trend.
 26.6% incidents where reported in the morning and 73.4% in the evening. The most fires (17.5%) took place on Saturday, and the least (13.0%) on Tuesday.
 According to the 154 reports from years 2002 - 2018 most fires (14.9%) took place during March, and the least (4.5%) in August.
 Out of all 541 cases reported during the years 2002 - 2018, the most belonged to the categories: Rescue & EMS (42.1%), Fire (28.5%), and Hazardous Condition (12.2%).
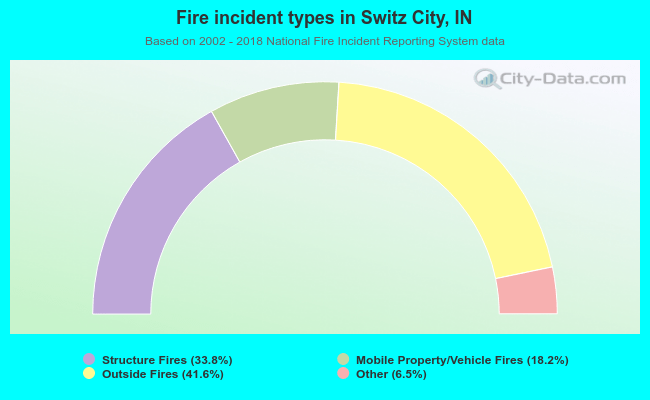 When looking into fire subcategories, the most incidents belonged to: Outside Fires (41.6%), and Structure Fires (33.8%).