| Fire incidents reported |
|---|
| Sreet name | Count |
|---|
| FM 281 | 62 | | FM 1060 | 38 | | FM 119 | 30 | | TEXAS BEEF RD | 14 | | TEXAS BEEF ROAD | 14 | | FM 1573 | 12 | | AVE J | 8 | | CEMETERY RD | 8 | | COUNTY RD CC | 8 | | MORTON ELEVATOR RD | 8 | | 281 1060 | 6 | | FISHER ROAD | 6 | | MAIN ST | 6 | | TX BEEF RD | 6 | | 1060 281 | 4 | | 1060 CO RD A | 4 | | 1060 CO RD I | 4 | | 281 TX BEEF RD | 4 | | AVE N | 4 | | AVE R | 4 | | CEMETERY ROAD | 4 | | COUNTY RD 25 | 4 | | COUNTY RD BB | 4 | | ENERGY TRANSFER PLANT | 4 | | HWY 119 1573 | 4 |
| | | Fire incidents reported |
|---|
| Sreet name | Count |
|---|
| TX BEEF ROAD | 4 | | 1 M S OF HWY 1573 ON CO RD 23 | 2 | | 1 MILE SOUTH OF CO RD CC ON HW | 2 | | 1 MILE WEST MORTON ELEVATOR RO | 2 | | 1000 AVE R | 2 | | 1000 BLOCK ALLEY | 2 | | 1003 HWY AVE | 2 | | 1012 AVE O | 2 | | 1060 CEMETARY RD | 2 | | 1060 COUNTY RD A | 2 | | 1060 MORTON ELEVATO RRD | 2 | | 1060 MORTON ELEVATOR ROAD | 2 | | 1060 MORTON RD | 2 | | 11 MILES EAST 281 | 2 | | 11 MILES EAST ON 281 | 2 | | 11 MILES NORTH ON HW119 HWY | 2 | | 119 COUNTY RD W | 2 | | 119 SOUTH OF VALERO | 2 | | 12 MILE SOUTH OF 1060 ON FM 2 | 2 | | 12 MILE SOUTH OF SUNRAY ON FM | 2 | | 12 S ON 2203 | 2 | | 1290 CR B | 2 | | 152 EAST OF 1060 | 2 | | 152 NAT GAS RD | 2 | | |
|
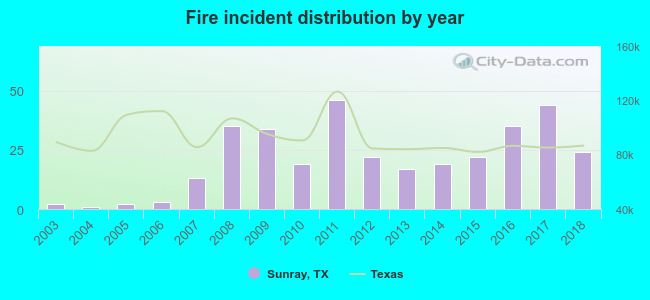 According to the data from the years 2003 - 2018 the average number of fire incidents per year is 21. The highest number of reported fire incidents - 46 took place in 2011, and the least - 1 in 2004. The data has a rising trend.
 21.9% incidents where reported in the morning and 78.1% in the evening. The most fires (17.2%) took place on Tuesday, and the least (11.5%) on Thursday.
 According to the 338 incident reports from years 2003 - 2018 most fires (13.0%) took place during October, and the least (5.6%) in September.
 Out of all 774 cases reported during the years 2003 - 2018, the most belonged to the categories: Fire (43.7%), Rescue & EMS (42.5%), and Hazardous Condition (4.8%).
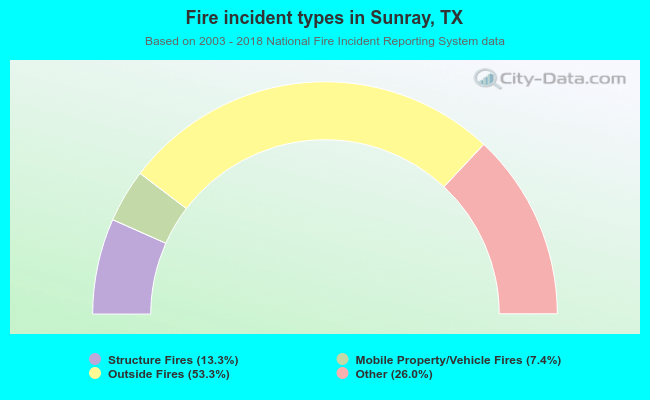 When looking into fire subcategories, the most reports belonged to: Outside Fires (53.3%), and Other (26.0%).