Sunnyvale: Fire Incidents, California (CA)
Where are fire incidents reported in Sunnyvale, CA
Something went wrong! Please refresh the page.
| Fire incidents reported | |
|---|---|
| Sreet name | Count |
| EL CAMINO REAL | 288 |
| TASMAN DR | 88 |
| FAIR OAKS AV | 82 |
| EVELYN AV | 78 |
| MATHILDA AV | 70 |
| AYALA DR | 54 |
| FAIR OAKS | 52 |
| HENDERSON AV | 52 |
| OLIVE AV | 50 |
| MARY AV | 48 |
| MORSE AV | 46 |
| WOLFE RD | 46 |
| FREMONT AV | 44 |
| MATHILDA | 44 |
| SUNNYVALE SARATOGA RD | 44 |
| KIFER RD | 42 |
| LAWRENCE EX | 42 |
| EVELYN | 40 |
| WEDDELL DR | 40 |
| ACALANES DR | 38 |
| N101 | 38 |
| REMINGTON DR | 38 |
| BERNARDO AV | 36 |
| ARQUES AV | 32 |
| CARIBBEAN DR | 32 |
| DUANE AV | 32 |
| OLD SAN FRANCISCO RD | 30 |
| HOLLENBECK AV | 28 |
| HOMESTEAD RD | 26 |
| LAKEHAVEN DR | 26 |
| Other | 530 |
2002 - 2018 National Fire Incident Reporting System (NFIRS) incidents
- Incident types reported to NFIRS in Sunnyvale, CA
- 25,58262.8%Rescue & EMS
- 4,28510.5%Good Intent Call
- 3,8569.5%Service Call
- 3,3838.3%False Alarm
- 2,1365.2%Fire
- 1,4543.6%Hazardous Condition
- Fire incident types reported to NFIRS in Sunnyvale, CA
- 84439.5%Outside Fires
- 72233.8%Structure Fires
- 41319.3%Mobile Property/Vehicle Fires
- 1577.4%Other
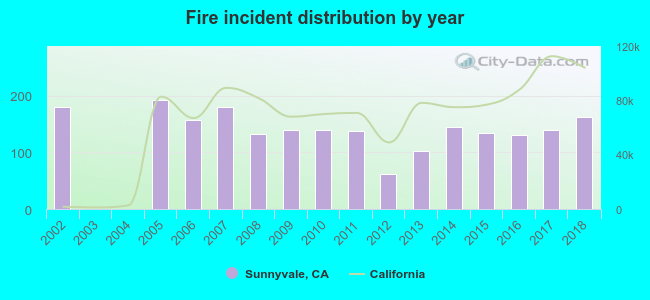 Based on the data from the years 2002 - 2018 the average number of fires per year is 126. The highest number of reported fires - 192 took place in 2005, and the least - 0 in 2003. The data has a dropping trend.
The average number of yearly fire incidents per 10k residents in Sunnyvale, CA compared to nearest cities:
(Note: Based on data for the last 3 years, including only cities with population 5,000 and above)
| Sunnyvale: | 9.6 |
| Santa Clara: | 1.8 |
| Mountain View: | 5.5 |
| Cupertino: | 13.1 |
| Los Altos: | 11.9 |
| Los Altos Hills: | 22.2 |
| Saratoga: | 8.6 |
| Campbell: | 20.7 |
| Palo Alto: | 18.5 |
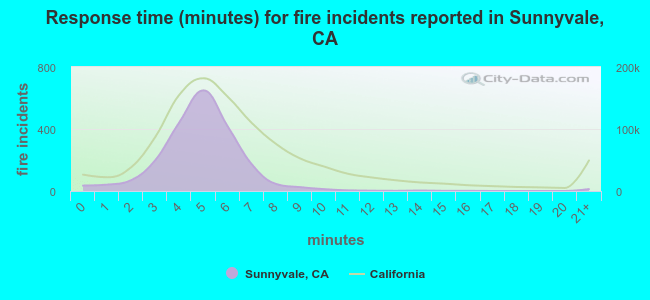 The median response time based on all reported fire incidents is 5 minutes. This is lower compared to the California median value.
The median response time in Sunnyvale, CA compared to nearest cities:
(Note: Based on data for all years, including only cities with at least 500 fire incidents)
| Sunnyvale: | 5 minutes |
| Mountain View: | 5 minutes |
| Cupertino: | 5 minutes |
| Campbell: | 5 minutes |
| Palo Alto: | 6 minutes |
| Milpitas: | 5 minutes |
| East Palo Alto: | 4 minutes |
| San Jose: | 6 minutes |
| Los Gatos: | 6 minutes |
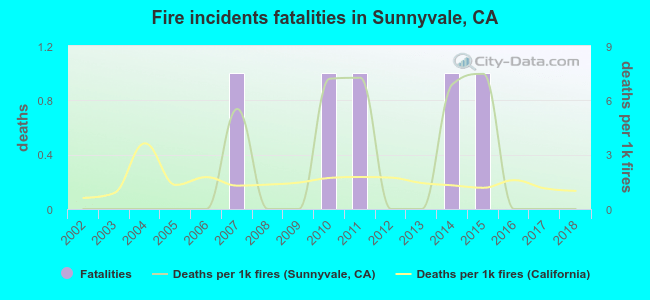 According to the data from the years 2002 - 2018 the average number of fire-related fatalities per year is 0. The highest number of deaths - 1 took place in 2007, and the lowest - 0 in 2002. The data has a constant trend.
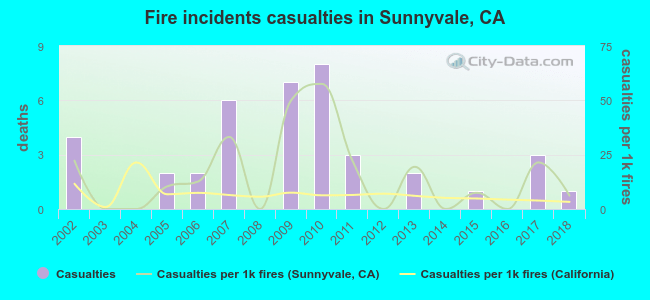 Based on the reports from the years 2002 - 2018 the average number of fire-related yearly casualties is 2. The highest number of reported injuries - 8 took place in 2010, and the lowest - 0 in 2003. The data has a decreasing trend.
The average number of injuries per 1,000 fire incidents is 15. This indicator was the highest - 58 in 2010, and the lowest 0 in 2003. The trend for casualties per 1,000 fire incidents is decreasing. Compared to the California value the number of injuries per 1,000 fire incidents is much higher.
Based on the reports from the years 2002 - 2018 the average number of fire-related yearly casualties is 2. The highest number of reported injuries - 8 took place in 2010, and the lowest - 0 in 2003. The data has a decreasing trend.
The average number of injuries per 1,000 fire incidents is 15. This indicator was the highest - 58 in 2010, and the lowest 0 in 2003. The trend for casualties per 1,000 fire incidents is decreasing. Compared to the California value the number of injuries per 1,000 fire incidents is much higher.Casualties per 1,000 incidents in Sunnyvale, CA compared to nearest cities:
(Note: Based on data for all years, including only cities with at least 500 fire incidents)
| Sunnyvale: | 18.3 |
| Mountain View: | 4.7 |
| Cupertino: | 13.3 |
| Campbell: | 24.7 |
| Palo Alto: | 3.0 |
| Milpitas: | 5.1 |
| East Palo Alto: | 6.1 |
| San Jose: | 8.7 |
| Los Gatos: | 19.7 |
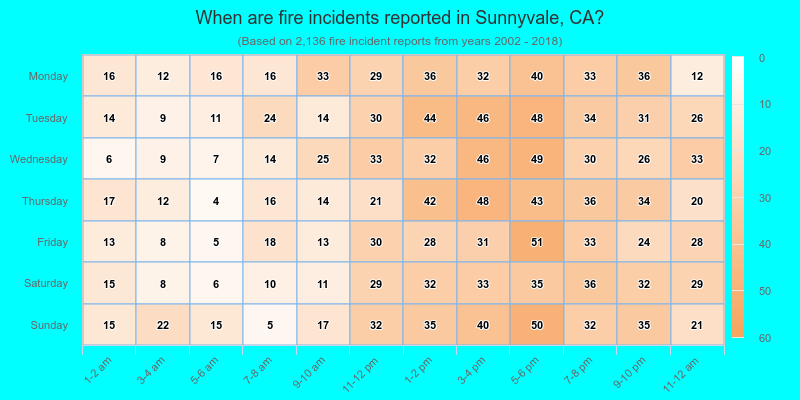
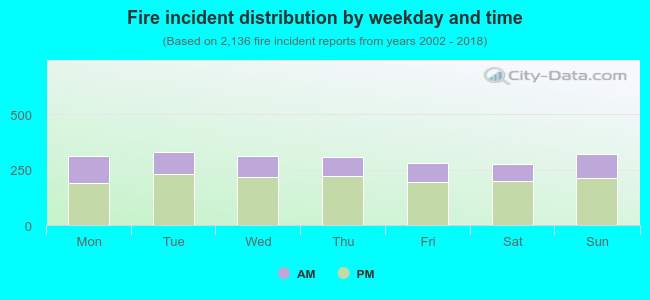 31.6% incidents where reported in the morning and 68.4% in the evening. The most fires (15.5%) took place on Tuesday, and the least (12.9%) on Saturday.
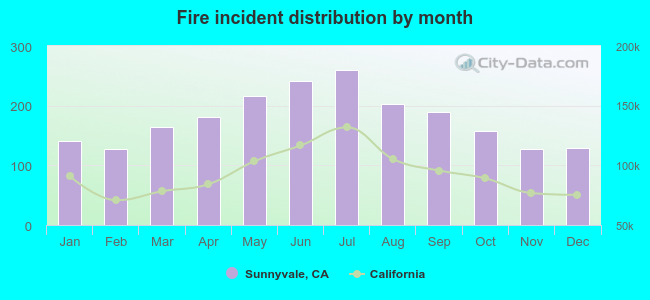 According to the 2,136 fire incidents from years 2002 - 2018 most fires (12.1%) took place during July, and the least (5.9%) in November.
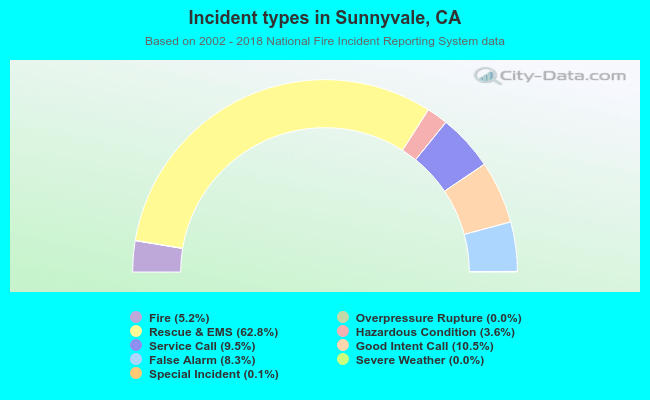 Out of all 40,743 cases reported during the years 2002 - 2018, the most belonged to the categories: Rescue & EMS (62.8%), Good Intent Call (10.5%), and Service Call (9.5%).
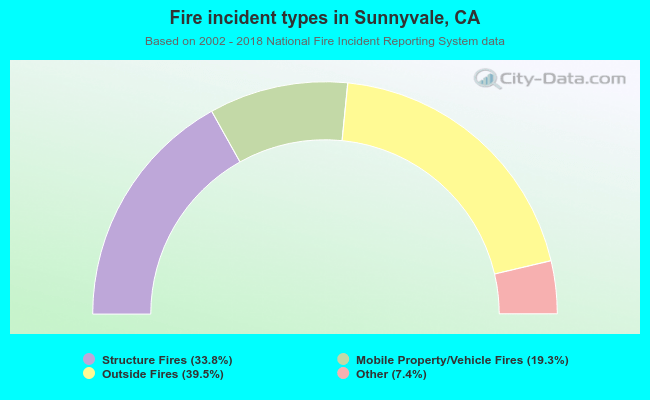 When looking into fire subcategories, the most incidents belonged to: Outside Fires (39.5%), and Structure Fires (33.8%).