Sullivan: Fire Incidents, New Hampshire (NH)
Where are fire incidents reported in Sullivan, NH
Something went wrong! Please refresh the page.
|
| |||||||||||||||||||||||||||||||||||||||||||||||||||||||||||||||||||||||||||||||||
2002 - 2018 National Fire Incident Reporting System (NFIRS) incidents
- Incident types reported to NFIRS in Sullivan, NH
- 33252.4%Rescue & EMS
- 10917.2%Hazardous Condition
- 10316.3%Fire
- 345.4%Service Call
- 264.1%Good Intent Call
- 162.5%False Alarm
- 101.6%Severe Weather
- 30.5%Special Incident
- Fire incident types reported to NFIRS in Sullivan, NH
- 5351.5%Structure Fires
- 4038.8%Outside Fires
- 65.8%Other
- 43.9%Mobile Property/Vehicle Fires
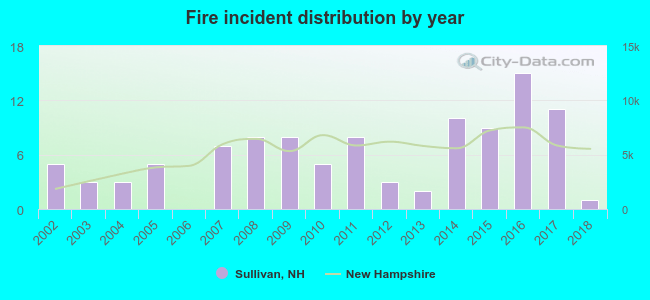 Based on the data from the years 2002 - 2018 the average number of fires per year is 6. The highest number of fire incidents - 15 took place in 2016, and the least - 0 in 2006. The data has a decreasing trend.
 35.0% incidents where reported in the morning and 65.0% in the evening. The most fires (25.2%) took place on Monday, and the least (3.9%) on Thursday.
 According to the 103 reports from years 2002 - 2018 most fires (18.4%) took place during April, and the least (1.9%) in November.
 Out of all 633 cases reported during the years 2002 - 2018, the most belonged to the categories: Overpressure Rupture (52.4%), Rescue & EMS (17.2%), and Fire (16.3%).
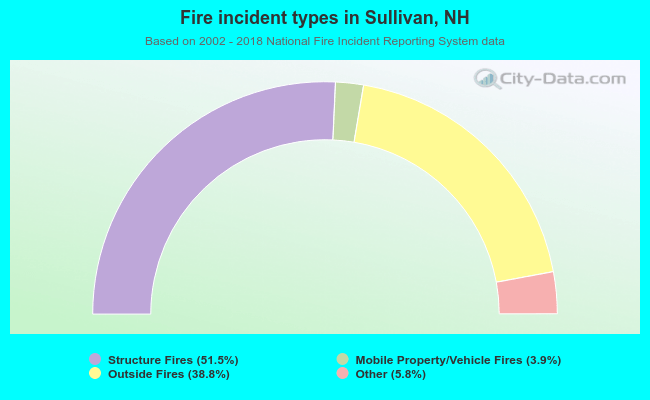 When looking into fire subcategories, the most incidents belonged to: Structure Fires (51.5%), and Outside Fires (38.8%).