Strasburg: Fire Incidents, Pennsylvania (PA)
Where are fire incidents reported in Strasburg, PA
Something went wrong! Please refresh the page.
|
| |||||||||||||||||||||||||||||||||||||||||||||||||||||||||||||||||||||||||||||||||||||||||||||||||||||||||||||
2002 - 2018 National Fire Incident Reporting System (NFIRS) incidents
- Incident types reported to NFIRS in Strasburg, PA
- 60649.1%Fire
- 31025.1%Hazardous Condition
- 1209.7%Service Call
- 826.7%Rescue & EMS
- 604.9%False Alarm
- 494.0%Good Intent Call
- 40.3%Special Incident
- Fire incident types reported to NFIRS in Strasburg, PA
- 38763.9%Structure Fires
- 10918.0%Other
- 7913.0%Outside Fires
- 315.1%Mobile Property/Vehicle Fires
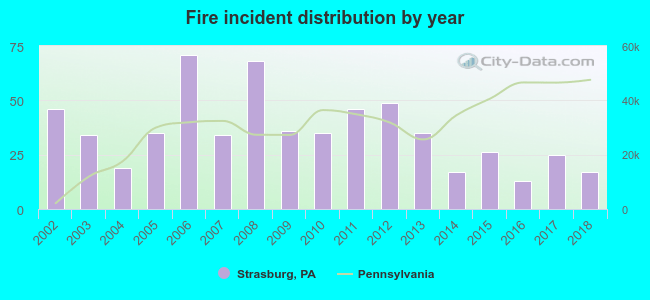 Based on the data from the years 2002 - 2018 the average number of fires per year is 36. The highest number of reported fires - 71 took place in 2006, and the least - 13 in 2016. The data has a declining trend.
 The median response time based on all reported fire incidents is 9 minutes. This is higher compared to the Pennsylvania median value.
The median response time in Strasburg, PA compared to nearest cities:
(Note: Based on data for all years, including only cities with at least 500 fire incidents)
| Strasburg: | 9 minutes |
| Paradise: | 7 minutes |
| Quarryville: | 9 minutes |
| Lancaster: | 7 minutes |
| Gap: | 8 minutes |
| Millersville: | 8 minutes |
| New Holland: | 7 minutes |
| Christiana: | 8 minutes |
| Lititz: | 9 minutes |
 30.0% incidents where reported in the morning and 70.0% in the evening. The most fires (17.3%) took place on Saturday, and the least (12.7%) on Tuesday.
 According to the 606 fires from years 2002 - 2018 most fires (11.7%) took place during February, and the least (4.1%) in July.
 Out of all 1,233 cases reported during the years 2002 - 2018, the most belonged to the categories: Fire (49.1%), Hazardous Condition (25.1%), and Service Call (9.7%).
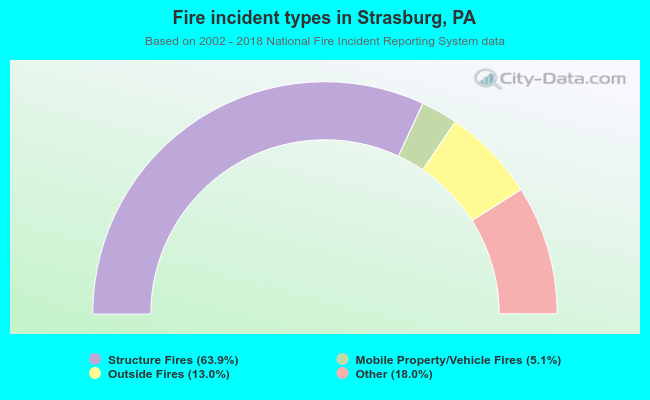 When looking into fire subcategories, the most incidents belonged to: Structure Fires (63.9%), and Other (18.0%).