Stoystown: Fire Incidents, Pennsylvania (PA)
Where are fire incidents reported in Stoystown, PA
Something went wrong! Please refresh the page.
|
| |||||||||||||||||||||||||||||||||||||||||||||||||||||||||||||||||||||||||||||||||||||||||||||||||||||||||||||
2004 - 2018 National Fire Incident Reporting System (NFIRS) incidents
- Incident types reported to NFIRS in Stoystown, PA
- 30440.2%Rescue & EMS
- 29138.5%Fire
- 557.3%Hazardous Condition
- 364.8%Severe Weather
- 253.3%Special Incident
- 182.4%False Alarm
- 152.0%Good Intent Call
- 111.5%Service Call
- 10.1%Overpressure Rupture
- Fire incident types reported to NFIRS in Stoystown, PA
- 16556.7%Structure Fires
- 6923.7%Outside Fires
- 3211.0%Mobile Property/Vehicle Fires
- 258.6%Other
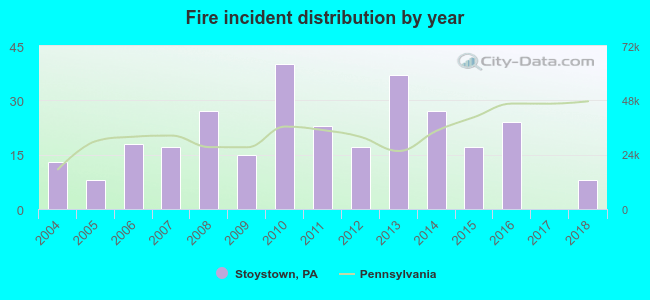 According to the data from the years 2004 - 2018 the average number of fires per year is 19. The highest number of reported fire incidents - 40 took place in 2010, and the least - 0 in 2017. The data has a decreasing trend.
 According to the reports from the years 2004 - 2018 the average number of fire-related casualties per year is 0. The highest number of casualties - 1 took place in 2005, and the lowest - 0 in 2004. The data has a constant trend.
 39.9% incidents where reported in the morning and 60.1% in the evening. The most fires (23.0%) took place on Friday, and the least (10.7%) on Sunday.
 According to the 291 incident reports from years 2004 - 2018 most fires (13.1%) took place during March, and the least (2.1%) in July.
 Out of all 756 cases reported during the years 2004 - 2018, the most belonged to the categories: Rescue & EMS (40.2%), Fire (38.5%), and Hazardous Condition (7.3%).
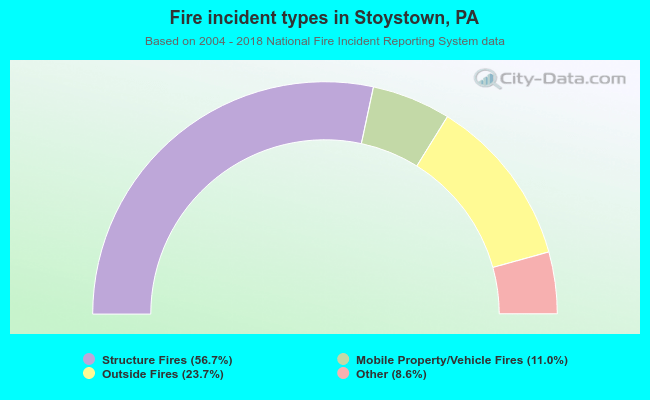 When looking into fire subcategories, the most incidents belonged to: Structure Fires (56.7%), and Outside Fires (23.7%).