Stoughton: Fire Incidents, Massachusetts (MA)
Where are fire incidents reported in Stoughton, MA
Something went wrong! Please refresh the page.
| Fire incidents reported | |
|---|---|
| Sreet name | Count |
| WASHINGTON ST | 574 |
| PARK ST | 382 |
| BRIAN DR | 376 |
| CENTRAL ST | 222 |
| WHEELER CIR | 200 |
| LACIVITA CT | 166 |
| SUMNER ST | 154 |
| ROSEWOOD DR | 150 |
| PEARL ST | 144 |
| PROSPECT ST | 132 |
| ERIN RD | 122 |
| CANTON ST | 106 |
| GREENBROOK DR | 106 |
| ETHYL WAY | 100 |
| PLEASANT ST | 98 |
| SCHOOL ST | 92 |
| LAURELWOOD DR | 84 |
| TECHNOLOGY DR | 76 |
| PORTER ST | 74 |
| TURNPIKE ST | 70 |
| CHRISTOPHER DR | 68 |
| MEADOWOOD DR | 64 |
| MORTON ST | 64 |
| PAGE ST | 62 |
| BRITTON AVE | 60 |
| PERRY ST | 56 |
| CAPEN ST | 54 |
| YORK ST | 52 |
| MANOR DR | 50 |
| JESSICA DR | 48 |
2002 - 2018 National Fire Incident Reporting System (NFIRS) incidents
- Incident types reported to NFIRS in Stoughton, MA
- 18,41351.0%Rescue & EMS
- 4,47712.4%False Alarm
- 4,23711.7%Hazardous Condition
- 3,3399.2%Fire
- 3,3059.2%Service Call
- 2,2246.2%Good Intent Call
- 820.2%Special Incident
- Fire incident types reported to NFIRS in Stoughton, MA
- 2,56476.8%Structure Fires
- 46914.0%Outside Fires
- 2567.7%Mobile Property/Vehicle Fires
- 501.5%Other
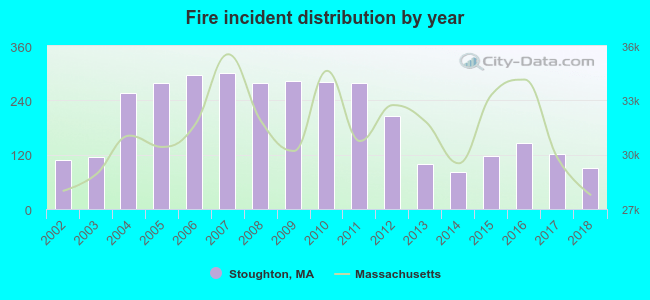 According to the data from the years 2002 - 2018 the average number of fires per year is 196. The highest number of reported fire incidents - 300 took place in 2007, and the least - 82 in 2014. The data has a declining trend.
The average number of yearly fire incidents per 10k residents in Stoughton, MA compared to nearest cities:
(Note: Based on data for the last 3 years, including only cities with population 5,000 and above)
| Stoughton: | 44.3 |
| Canton: | 29.2 |
| Sharon: | 86.6 |
| Randolph: | 60.2 |
| Holbrook: | 47.3 |
| Brockton: | 60.2 |
| Easton: | 23.4 |
| Norwood: | 40.4 |
| Walpole: | 123.4 |
 The median response time based on all reported fire incidents is 3 minutes. This is lower than the state median value.
The median response time in Stoughton, MA compared to nearest cities:
(Note: Based on data for all years, including only cities with at least 500 fire incidents)
| Stoughton: | 3 minutes |
| Canton: | 5 minutes |
| Avon: | 4 minutes |
| Sharon: | 5 minutes |
| Randolph: | 3 minutes |
| Holbrook: | 3 minutes |
| Brockton: | 4 minutes |
| Easton: | 5 minutes |
| Norwood: | 4 minutes |
 Based on the reports from the years 2002 - 2018 the average number of fire-related yearly casualties is 1. The highest number of reported injuries - 4 took place in 2004, and the lowest - 0 in 2003. The data has a rising trend.
The average number of injuries per 1,000 fires is 9. This indicator was the highest - 33 in 2018, and the lowest 0 in 2003. The trend for injuries per 1,000 fire incidents is growing. Compared to the state value the number of injuries per 1,000 fires is lower.
Based on the reports from the years 2002 - 2018 the average number of fire-related yearly casualties is 1. The highest number of reported injuries - 4 took place in 2004, and the lowest - 0 in 2003. The data has a rising trend.
The average number of injuries per 1,000 fires is 9. This indicator was the highest - 33 in 2018, and the lowest 0 in 2003. The trend for injuries per 1,000 fire incidents is growing. Compared to the state value the number of injuries per 1,000 fires is lower.
 29.2% incidents where reported in the morning and 70.8% in the evening. The most fires (15.7%) took place on Saturday, and the least (13.3%) on Wednesday.
 Based on the 3,339 incident reports from years 2002 - 2018 most fires (11.2%) took place during April, and the least (6.2%) in February.
 Out of all 36,111 cases reported during the years 2002 - 2018, the most belonged to the categories: Rescue & EMS (51.0%), False Alarm (12.4%), and Hazardous Condition (11.7%).
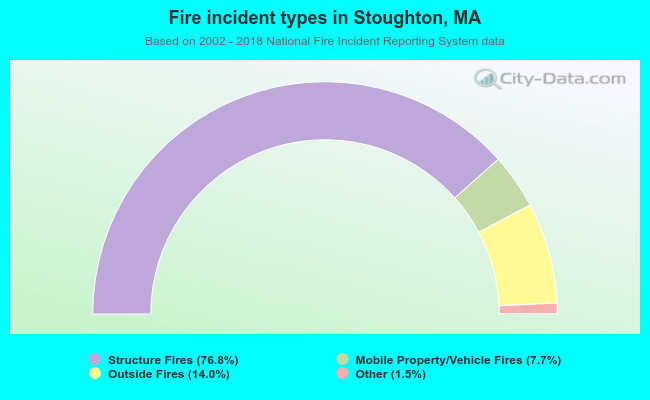 When looking into fire subcategories, the most incidents belonged to: Structure Fires (76.8%), and Outside Fires (14.0%).