Stonewall: Fire Incidents, Oklahoma (OK)
Where are fire incidents reported in Stonewall, OK
Something went wrong! Please refresh the page.
|
| |||||||||||||||||||||||||||||||||||||||||||||||||||||||||||||||||||||||||||||||||||||||||||||||||||||||||||||
| Other | 125 | |||||||||||||||||||||||||||||||||||||||||||||||||||||||||||||||||||||||||||||||||||||||||||||||||||||||||||||
2003 - 2018 National Fire Incident Reporting System (NFIRS) incidents
- Incident types reported to NFIRS in Stonewall, OK
- 46554.6%Fire
- 28133.0%Rescue & EMS
- 495.8%Good Intent Call
- 333.9%Hazardous Condition
- 141.6%Service Call
- 70.8%False Alarm
- 20.2%Special Incident
- 10.1%Severe Weather
- Fire incident types reported to NFIRS in Stonewall, OK
- 36177.6%Outside Fires
- 7917.0%Structure Fires
- 173.7%Mobile Property/Vehicle Fires
- 81.7%Other
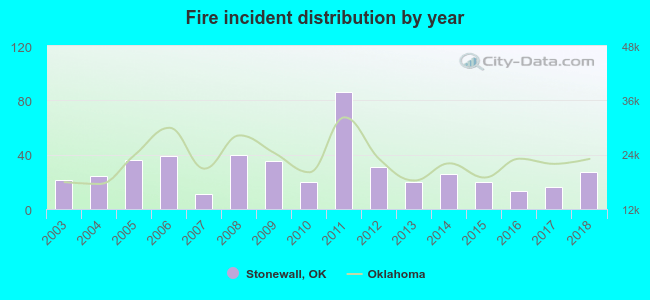 According to the data from the years 2003 - 2018 the average number of fire incidents per year is 29. The highest number of reported fires - 86 took place in 2011, and the least - 11 in 2007. The data has a rising trend.
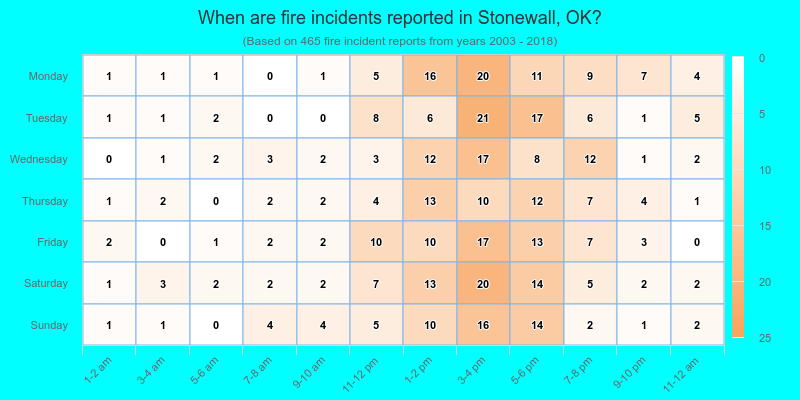
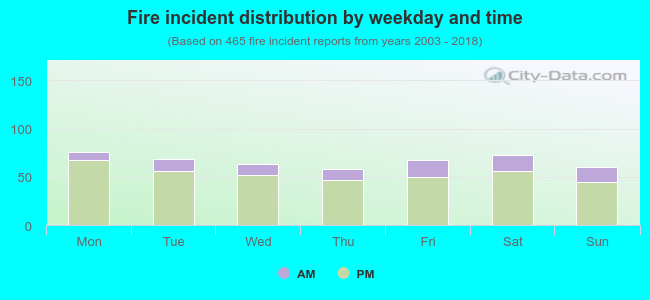 19.8% incidents where reported in the morning and 80.2% in the evening. The most fires (16.3%) took place on Monday, and the least (12.5%) on Thursday.
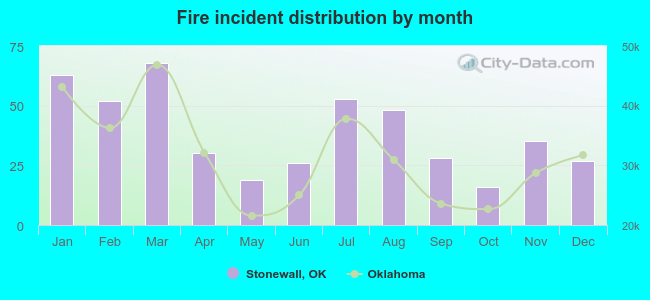 According to the 465 reports from years 2003 - 2018 most fires (14.6%) took place during March, and the least (3.4%) in October.
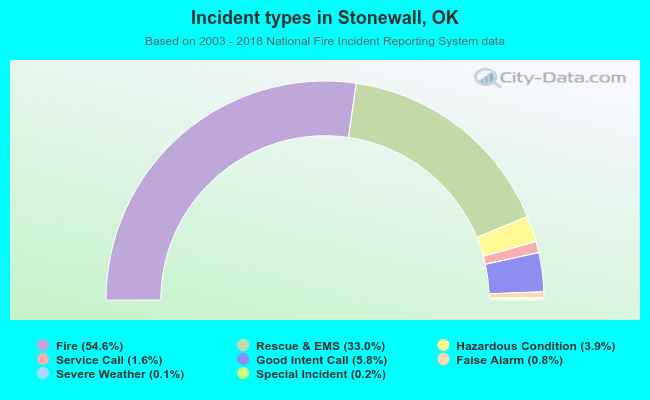 Out of all 852 cases reported during the years 2003 - 2018, the most belonged to the categories: Fire (54.6%), Overpressure Rupture (33.0%), and Service Call (5.8%).
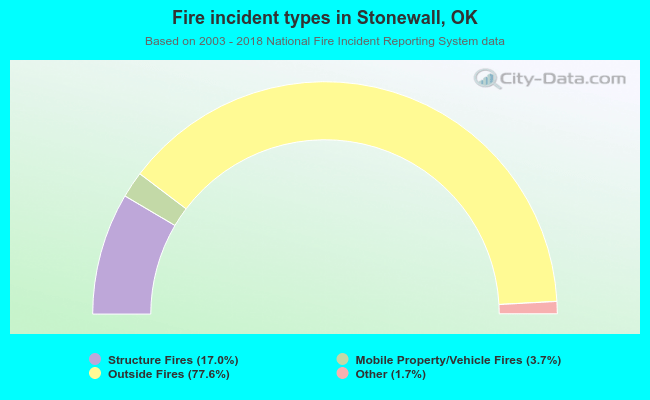 When looking into fire subcategories, the most incidents belonged to: Outside Fires (77.6%), and Structure Fires (17.0%).