Stockton: Fire Incidents, Illinois (IL)
Where are fire incidents reported in Stockton, IL
Something went wrong! Please refresh the page.
|
| |||||||||||||||||||||||||||||||||||||||||||||||||||||||||||||||||||||||||||||||||||||||||||||||||||||||||||||
2002 - 2017 National Fire Incident Reporting System (NFIRS) incidents
- Incident types reported to NFIRS in Stockton, IL
- 46848.3%Fire
- 17918.5%Hazardous Condition
- 16116.6%Rescue & EMS
- 919.4%False Alarm
- 323.3%Service Call
- 181.9%Severe Weather
- 141.4%Good Intent Call
- 30.3%Special Incident
- 20.2%Overpressure Rupture
- Fire incident types reported to NFIRS in Stockton, IL
- 20744.2%Outside Fires
- 18740.0%Structure Fires
- 5912.6%Mobile Property/Vehicle Fires
- 153.2%Other
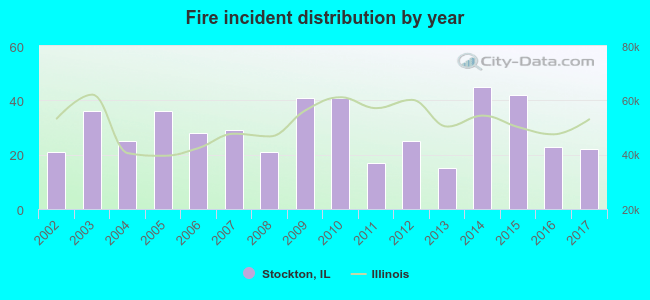 Based on the data from the years 2002 - 2017 the average number of fire incidents per year is 29. The highest number of fires - 45 took place in 2014, and the least - 15 in 2013. The data has an increasing trend.
 Based on the reports from the years 2002 - 2017 the average number of fire-related fatalities per year is 0. The highest number of deaths - 1 took place in 2002, and the lowest - 0 in 2004. The data has a dropping trend.
 32.5% incidents where reported in the morning and 67.5% in the evening. The most fires (17.7%) took place on Tuesday, and the least (12.0%) on Thursday.
 Based on the 468 incident reports from years 2002 - 2017 most fires (19.7%) took place during April, and the least (4.3%) in July.
 Out of all 968 cases reported during the years 2002 - 2017, the most belonged to the categories: Fire (48.3%), Hazardous Condition (18.5%), and Rescue & EMS (16.6%).
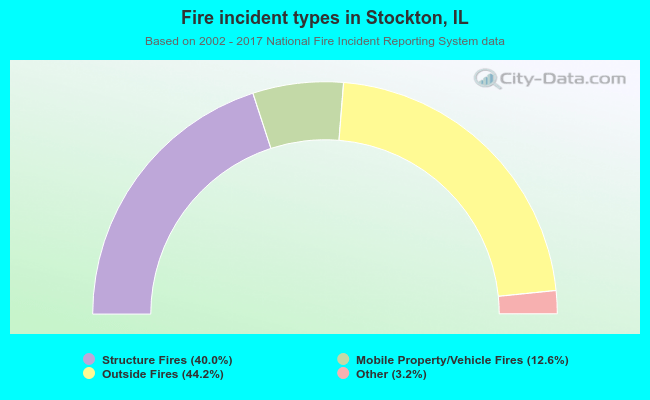 When looking into fire subcategories, the most incidents belonged to: Outside Fires (44.2%), and Structure Fires (40.0%).