Stillman Valley: Fire Incidents, Illinois (IL)
Where are fire incidents reported in Stillman Valley, IL
Something went wrong! Please refresh the page.
|
| |||||||||||||||||||||||||||||||||||||||||||||||||||||||||||||||||||||||||||||||||||||||||||||||||||||||||||||
2002 - 2018 National Fire Incident Reporting System (NFIRS) incidents
- Incident types reported to NFIRS in Stillman Valley, IL
- 64447.2%Rescue & EMS
- 38228.0%Fire
- 17112.5%Service Call
- 674.9%Hazardous Condition
- 533.9%False Alarm
- 392.9%Good Intent Call
- 50.4%Special Incident
- Fire incident types reported to NFIRS in Stillman Valley, IL
- 19551.0%Outside Fires
- 15841.4%Structure Fires
- 215.5%Mobile Property/Vehicle Fires
- 82.1%Other
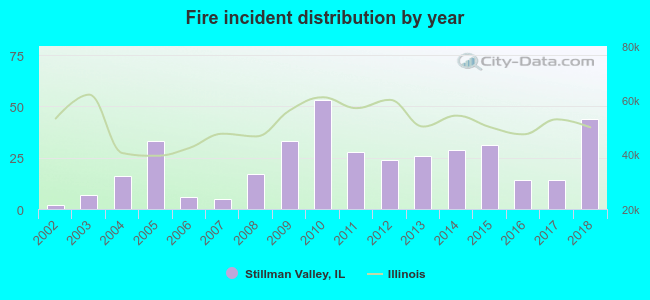 Based on the data from the years 2002 - 2018 the average number of fire incidents per year is 22. The highest number of fires - 53 took place in 2010, and the least - 2 in 2002. The data has an increasing trend.
 24.3% incidents where reported in the morning and 75.7% in the evening. The most fires (18.3%) took place on Tuesday, and the least (11.3%) on Friday.
 Based on the 382 incident reports from years 2002 - 2018 most fires (20.4%) took place during April, and the least (2.4%) in December.
 Out of all 1,363 cases reported during the years 2002 - 2018, the most belonged to the categories: Rescue & EMS (47.2%), Fire (28.0%), and Service Call (12.5%).
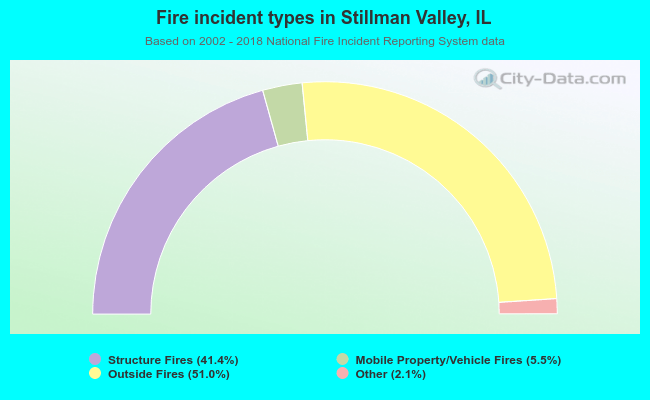 When looking into fire subcategories, the most incidents belonged to: Outside Fires (51.0%), and Structure Fires (41.4%).