| Fire incidents reported |
|---|
| Sreet name | Count |
|---|
| GIRL SCOUT RD | 16 | | KLEINFELTERSVILLE RD | 14 | | PENNSYLVANIA TPKE | 14 | | INDIANTOWN RD | 12 | | WOLLUPS HILL RD | 12 | | KING ST | 10 | | READING RD | 10 | | SANDY HILL RD | 10 | | SWAMP BRIDGE RD | 10 | | LINE RD | 8 | | COCALICO RD | 6 | | DURLACH HILL RD | 6 | | BINDER RD | 4 | | CHURCH ST | 4 | | FURNACE HILL RD | 4 | | HILLTOP RD | 4 | | LANDIS RD | 4 | | MOUNT AIRY RD | 4 | | PFAUTZ HILL RD | 4 | | PIEFFER HILL RD | 4 | | READING RD | 4 | | RIDGE AVE | 4 | | SHORT RD | 4 | | STEVENS RD | 4 | | BUNKER HILL RD | 2 |
| | | Fire incidents reported |
|---|
| Sreet name | Count |
|---|
| CAMP RD | 2 | | CHURCH RD | 2 | | COCALICO CREEK RD | 2 | | COCALICO CREEK RD | 2 | | DURLACH HILL RD | 2 | | DURLACH RD | 2 | | EBERSOLE RD | 2 | | FAWN HOLLOW RD | 2 | | FOREST HILL RD | 2 | | FRITZTOWN RD | 2 | | FURNACE HILLS RD | 2 | | GIRLSCOUT | 2 | | GIRLSCOUT RD | 2 | | GOCKLEY RD | 2 | | HAHNSTOWN RD | 2 | | HARTINGS PARK RD | 2 | | HICKORY RD | 2 | | HILL RD | 2 | | HILLSIDE RD | 2 | | HOMESTEAD DR | 2 | | JOSHUA LN | 2 | | KLEINFELTERSVILLE RD | 2 | | KRAMER MILL RD | 2 | | KURTZ RD | 2 | | |
|
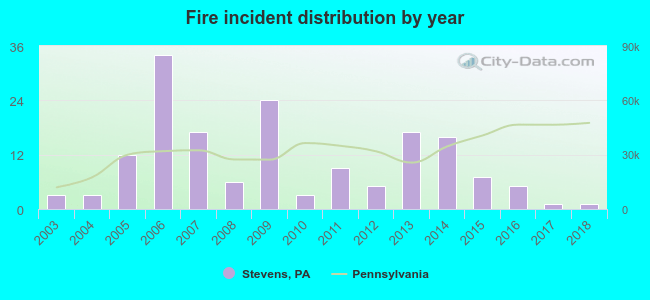 According to the data from the years 2003 - 2018 the average number of fires per year is 10. The highest number of reported fire incidents - 34 took place in 2006, and the least - 1 in 2017. The data has a decreasing trend.
 37.4% incidents where reported in the morning and 62.6% in the evening. The most fires (19.0%) took place on Saturday, and the least (9.8%) on Sunday.
 According to the 163 incident reports from years 2003 - 2018 most fires (17.2%) took place during March, and the least (3.1%) in July.
 Out of all 464 cases reported during the years 2003 - 2018, the most belonged to the categories: Rescue & EMS (35.6%), Fire (35.1%), and Hazardous Condition (14.0%).
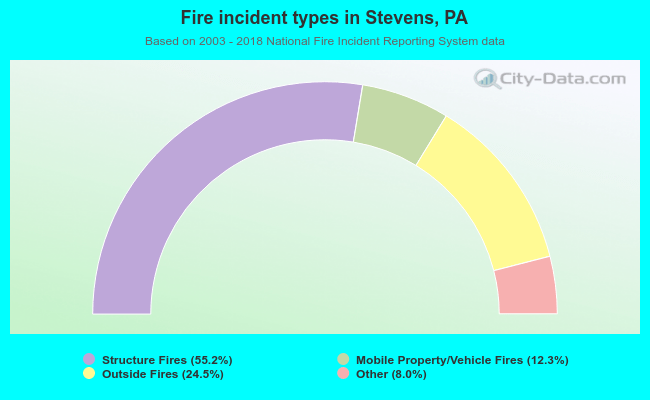 When looking into fire subcategories, the most incidents belonged to: Structure Fires (55.2%), and Outside Fires (24.5%).