| Fire incidents reported |
|---|
| Sreet name | Count |
|---|
| SHAWNEETOWN TRAIL | 8 | | EAST MAIN ST | 6 | | N. SPARTA | 6 | | 3306 COUNTY RD. 5 | 4 | | 607 W. CHADRON | 4 | | E MAIN ST | 4 | | NORTH SPARTA | 4 | | NORTH SPARTA ST. | 4 | | OAK GROVE ROAD | 4 | | SUBSTATION RD | 4 | | WESTWOOD DR | 4 | | WINEHILL ROAD | 4 | | 100 JUDI LN | 2 | | 101 WELGE DR | 2 | | 104 W. JENKINS | 2 | | 107 BROADWAY | 2 | | 10790 SHAWNEETOWN TRAIL | 2 | | 10911 SHAWNEETOWN TRL | 2 | | 11 ERIN DRIVE | 2 | | 11120 SUBSTATION RD | 2 | | 11224 MEADOWLARK LANE | 2 | | 11235 SUBSTATION RD. | 2 | | 11235 SUBSTATION ROAD | 2 | | 11335 OAK TERRACE LANE | 2 | | 11372 OAK TERRACE | 2 |
| | | Fire incidents reported |
|---|
| Sreet name | Count |
|---|
| 11542 WINE HILL RD | 2 | | 11936 ROCKCASTLE LANE | 2 | | 12142 MURPHYSBORO RD | 2 | | 12318A EGGERS LANE | 2 | | 1315 SHAWNEETOWN TRAIL | 2 | | 2 MILE NORTH ON EDEN ROAD | 2 | | 201 E. JEFFERSON | 2 | | 204 N JAMES | 2 | | 205 JUDI LANE | 2 | | 207 E. JENKINS | 2 | | 207 W. MAIN | 2 | | 300 BLOCK ILLINOIS ST. | 2 | | 3025 COUNTY RD 5 | 2 | | 3059 COUNTY RD. 5 | 2 | | 314 LAKE VIEW DR. | 2 | | 3306 COUNTY ROAD 5 | 2 | | 3872 RICKENBERG LANE | 2 | | 401 JUDI LANE | 2 | | 404 N. SPARTA ST. | 2 | | 404 NORTH CHARLES | 2 | | 4050 ROCKCASTLE ROAD | 2 | | 407 E MAIN | 2 | | 407 W JASPER | 2 | | 4508 ROCKCASTLE RD | 2 | | 4514 BALLPARK ROAD | 2 |
|
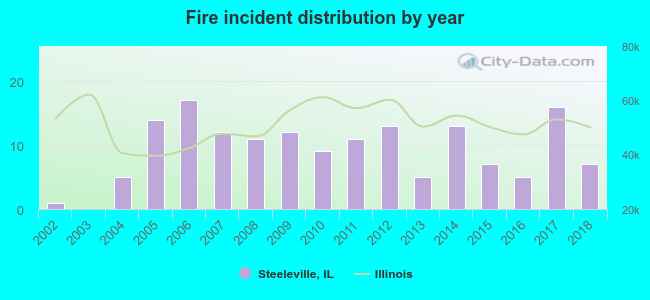 According to the data from the years 2002 - 2018 the average number of fires per year is 9. The highest number of reported fire incidents - 17 took place in 2006, and the least - 0 in 2003. The data has an increasing trend.
 27.8% incidents where reported in the morning and 72.2% in the evening. The most fires (18.4%) took place on Tuesday, and the least (10.8%) on Sunday.
 According to the 158 reports from years 2002 - 2018 most fires (13.3%) took place during July, and the least (4.4%) in February.
 Out of all 1,158 cases reported during the years 2002 - 2018, the most belonged to the categories: Rescue & EMS (77.0%), Fire (13.6%), and Good Intent Call (4.1%).
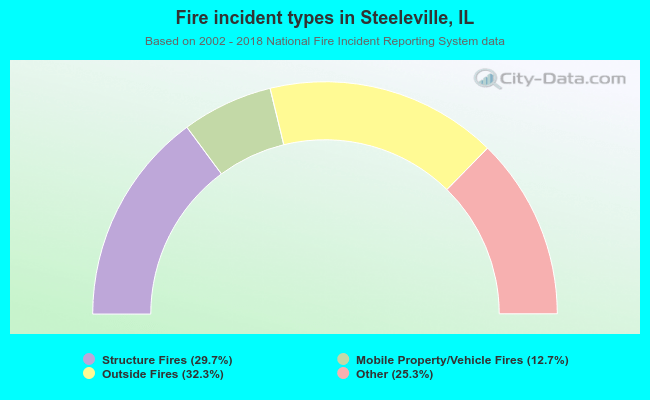 When looking into fire subcategories, the most reports belonged to: Outside Fires (32.3%), and Structure Fires (29.7%).