Stanford: Fire Incidents, Illinois (IL)
Where are fire incidents reported in Stanford, IL
Something went wrong! Please refresh the page.
|
| |||||||||||||||||||||||||||||||||||||||||||||||||||||||||||||||||||||||||||||||||||||||||||||||||||||||||||||
2002 - 2018 National Fire Incident Reporting System (NFIRS) incidents
- Incident types reported to NFIRS in Stanford, IL
- 22444.4%Rescue & EMS
- 14228.1%Fire
- 5711.3%Hazardous Condition
- 5510.9%Good Intent Call
- 163.2%Service Call
- 112.2%False Alarm
- Fire incident types reported to NFIRS in Stanford, IL
- 6948.6%Structure Fires
- 5538.7%Outside Fires
- 1510.6%Mobile Property/Vehicle Fires
- 32.1%Other
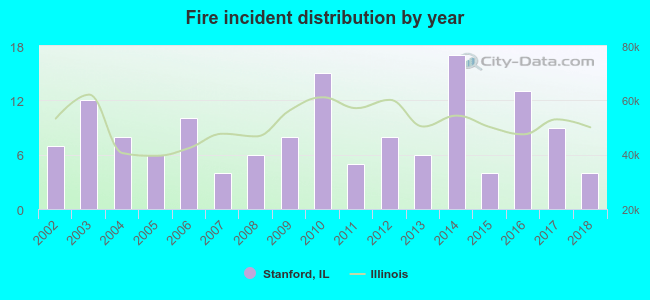 According to the data from the years 2002 - 2018 the average number of fires per year is 8. The highest number of reported fire incidents - 17 took place in 2014, and the least - 4 in 2007. The data has a decreasing trend.
 35.9% incidents where reported in the morning and 64.1% in the evening. The most fires (23.2%) took place on Monday, and the least (7.0%) on Wednesday.
 According to the 142 reports from years 2002 - 2018 most fires (18.3%) took place during September, and the least (2.8%) in August.
 Out of all 505 cases reported during the years 2002 - 2018, the most belonged to the categories: Overpressure Rupture (44.4%), Fire (28.1%), and Rescue & EMS (11.3%).
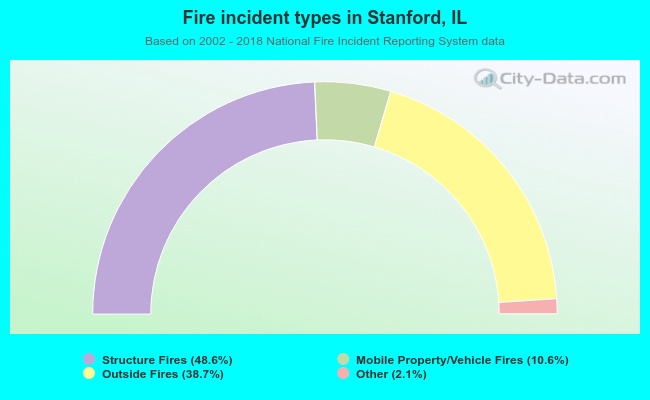 When looking into fire subcategories, the most reports belonged to: Structure Fires (48.6%), and Outside Fires (38.7%).